Bullish View
- Buy the BTC/USD pair and set a take-profit at 45,480.
- Add a stop-loss at 42,000.
- Timeline: 1-2 days.
Bearish View
- Set a sell-stop at 42,000 and a take-profit at 40,000.
- Add a stop-loss at 44,000.
The BTC/USD price continued its cautious recovery as investors predicted that the rising inflation in the United States may have peaked. The pair rose to a high of 44,000, which was substantially higher than this week’s low of about 39,800.
Bitcoin and Inflation
Bitcoin price rallied as investors reflected on the American inflation data. The rally also coincided with the overall positive performance of other assets like gold and stocks. The Dow Jones and S&P 500 indices rose by about 0.20% on Wednesday.
The jump happened after the US published the latest consumer inflation data. The numbers revealed that the country’s inflation jumped to 7%, the highest it has been since 1982. The core CPI also jumped to 5.5% in December.
These numbers came a few days after the US published the latest employment numbers. The data showed that the unemployment rate declined to 3.9% in December, which was the lowest level since the Covid-19 pandemic started.
The Federal Reserve has two main mandates. It is supposed to ensure that inflation and unemployment rate remains as low as possible. Therefore, these numbers mean that the Fed will need to intervene in the coming months. The Fed chair confirmed this view in his testimony on Tuesday.
Therefore, the BTC/USD pair rose after the strong inflation data because they signalled that inflation may have peaked.
Meanwhile, on-chain data shows that activity in the Bitcoin ecosystem is doing well. For example, data shows that the number of big Bitcoin holders is growing. Most importantly, the biggest Bitcoin addressess have continued to add to their positions.
BTC/USD Forecast
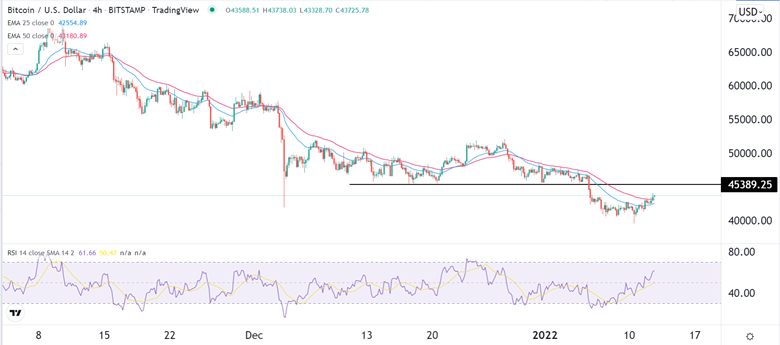
The BTC/USD pair has been in a bullish trend in the past few days. This jump happened after the pair managed to move below the key support at 40,000. Therefore, to some extent, this recovery rally can be considered a dead cat bounce.
The four-hour chart shows that the 25-day and 50-day exponential moving averages (EMA) have made a bullish crossover. The Relative Strength Index (RSI) has continued moving upwards.
Therefore, the pair will likely keep rising as bulls attempt to retest the key resistance level at 45,390. The pair had struggled moving below that level several times in December.
If this view works, the pair will likely do a break and retest pattern and resume the bearish trend and test the support at 40,000.

