Bearish View
Sell the BTC/USD pair and set a take-profit at 45,000.
Add a stop-loss at 48,000.
Timeline: 1-2 days.
Bullish View
Set a buy-stop at 47,500 and add a take-profit at 49,000.
Add a stop-loss at 46,000.
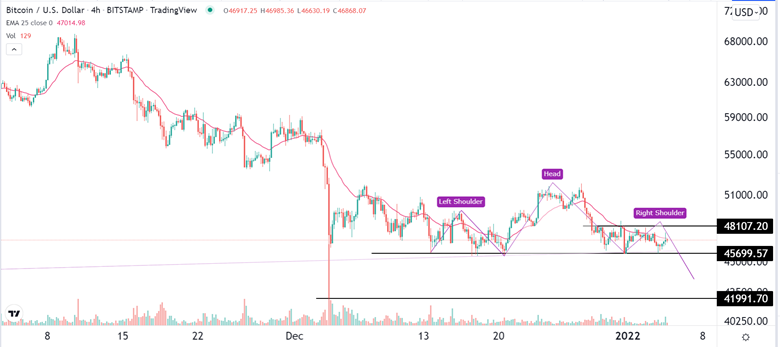
The BTC/USD pair remained in a tight range slightly above a key support level as investors focused on the strong US dollar. The pair is trading at 46,730, which is slightly above the key support level at 45,700, where it struggled to move below in December.
Strong US Dollar
The BTC/USD pair struggled as the US dollar bounced back. The currency rose to the highest level since January 2017 against the Japanese yen. The dollar index, which tracks the greenback against a basket of currencies like the euro and sterling also rose.
This increase happened as investors positioned themselves for a more hawkish Federal Reserve. The Fed has hinted that it will start hiking interest rates this year. Precisely, the bank expects to implement about three hikes.
It is not alone. The Bank of Canada (BOC) and Bank of England (BOE) have already started their hiking cycle. And more banks will likely follow this trend since the global economy is expected to rebound in the coming months.
Meanwhile, analysts are torn about the future of Bitcoin. In an interview with CNBC, the founder and CEO of Nexo estimated that BTC will jump to about $100,000 this year. He cited the growing institutional adoption as regulations become clearer.
He also said that interest rates will remain low for a while. While the Fed is expected to start tightening this year, rates will remain at historic lows for more years to come.
Still, some analysts are pessimistic about Bitcoin. In a statement to CNBC, Carol Alexander of Sussex University said that she believed that BTC/USD will drop to about 10,000. She cited the substantial swings of Bitcoin prices and global regulatory scrutiny. Countries like Turkey and India are expected to unveil their regulations soon.
BTC/USD Forecast
The four-hour chart shows that the BTC/USD pair has found a lot of support at the 45,700 level. The pair is slightly above this level and is along the 25-day moving average. It has also formed what looks like a head and shoulders pattern. In price action analysis, this pattern is usually a bearish sign. Volume has also declined in the past few days.
Therefore, while the overall outlook of Bitcoin is bullish, a major bearish breakout cannot be ruled out. If it happens, the pair will likely drop to about 43,000.

