Bearish View
Sell the EUR/USD and set a take-profit at 1.1250.
Add a stop-loss at 1.1430.
Timeline: 3 days.
Bullish View
Set a buy-stop at 1.1390 and a take-profit at 1.1450.
Add a stop-loss at 1.1300.
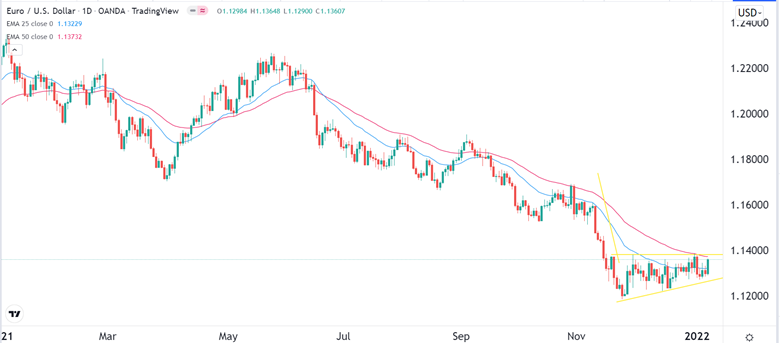
The EUR/USD pair tilted higher on Friday as investors reflected on the latest American jobs numbers. The pair is trading at 1.1360, which was higher than last week’s low of 1.1280.
US NFP Data
The US labor market is going through a strong transition as the economy reopens from the Covid-19 pandemic. Data published last week sent a mixed situation about the labor market.
On Tuesday, data by the Bureau of Labor Statistics (BLS) showed that there were over 10 million job vacancies in the United States. At the same time, the great resignation continued as more than 4 million people left the job market.
On Wednesday, data by ADP revealed that the country’s private sector added over 800k jobs in December. That was about 300k more than what it added in the previous month. Further, on Thursday, official numbers revealed that the country’s initial jobless claims are hovering at about 200k.
Finally, on Friday, the BLS said that the job market slowed in December as the economy added less than 200k jobs in December. This figure was substantially lower than the 422k that analysts were expecting.
However, the closely watched unemployment rate figure declined to a pandemic-era low of 3.9% in December. It has declined consistently in the past few straight months. Another impressive number was on wages, which analysts were watching closely. Average hourly earnings rose by 0.6% from November, leading to an annual increase of 4.7%.
Therefore, despite the disappointing headline figure, analysts believe that the Federal Reserve will continue to tighten market conditions this year. It will achieve that by ending its quantitative easing policies and then hiking interest rates. Analysts at banks like Barclays believe that the Fed will hike in March this year.
EUR/USD Forecast
Turning to the daily chart, we see that the EUR/USD pair has been in a tight range in the past few months. As a result, the pair has moved between the 25-day and 50-day exponential moving averages. A closer look shows that the chart has formed a bearish flag pattern that is shown in yellow. The price is currently slightly below the upper side of the flag pattern.
Therefore, there is a likelihood that the pair will break out lower in the coming days as investors anticipate a divergence between the Fed and the ECB.

