The difference between success and failure in Forex trading is very likely to depend mostly upon which currency pairs you choose to trade each week and in which direction, and not on the exact trading methods you might use to determine trade entries and exits.
When starting the trading week, it is a good idea to look at the big picture of what is developing in the market as a whole and how such developments and affected by macro fundamentals and market sentiment.
Big Picture 23rd January 2022
As the new calendar year has gotten underway, markets are continuing to sour compared to December’s broad bullishness on stocks and other risky assets. Last week saw most global stock markets fall strongly, especially in the US, although we did not see much movement in the Forex market. Almost all cryptocurrencies also fell strongly.
Last week was dominated by US treasury yields rising to reach new long-term highs and increasing expectations from analysts that the US Federal Reserve will require 4 rate hikes over the course of 2022 and not the three which had previously been expected, which sparked a selloff in global stock markets, especially the US market. Last week also saw higher than expected British inflation data and very strong Australian unemployment data.
Stock markets are strongly lower, with the US benchmark S&P 500 Index closing below its 200-day moving average for the first time in almost 18 months. The Japanese yen has been the major gainer of the week in the currency market. This is a typically bearish combination for the stock market and suggests that right now is not likely to be a great time to buy stocks, until this sentiment improves.
Many commodities, especially agricultural commodities, sold off sharply at the end of last week, but WTI crude oil, gold, and silver are continuing to look relatively bullish with only minor bearish retracements.
The omicron coronavirus variant continues to spread extremely quickly, sending new cases soaring to record highs last week. However, it appears the risk of severe disease is now considerably lower due to the nature of the variant and widespread vaccination, so it did not affect risk sentiment greatly.
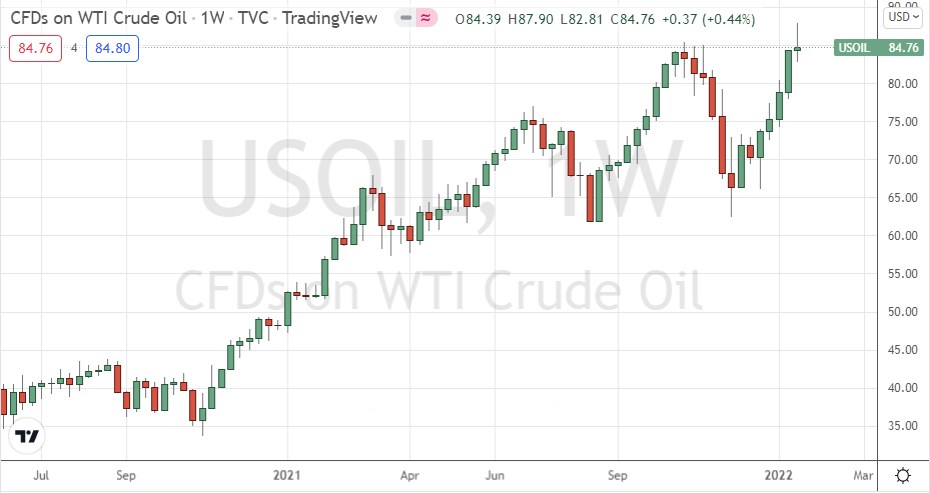
I wrote in my previous piece last week that the best trades for the week were likely to be long of WTI Crude Oil following a daily (New York) close above $85.39 or long of BTC/USD following a daily (New York) close above $45,668. This was a good call on Bitcoin as I was correct to wait for the specified breakout before entering, which never came and therefore prevented what would have been a losing trade. However, we did get a trade entry on WTI Crude Oil at $86.52 which closed lower for the week by 2.03% producing a loss.
Fundamental Analysis & Market Sentiment
The headline takeaways from last week were:
- The benchmark US stock market index, the S&P 500, closed strongly lower and ended the week below its 200-day moving average for the first time in approximately 18 months.
- US treasury yields for 10 years and 2 years are rising to new highs.
- UK CPI (inflation) data came in slightly higher than had been expected, at an annualized inflation rate to 5.4%, the highest rate seen since 1992.
- Very strong Australian employment data temporarily boosted the Australian dollar. The Australian unemployment rate fell to only 4.2% when most analysts had expected a rate of 4.5% to be announced.
- The Bank of Japan raised its inflation outlook.
The coming week is likely to see a higher level of volatility compared to last week, with markets seeming to have moved very strongly into risk-off mode, which could see further strong falls in stocks and a rise in the Japanese Yen. Additionally, the US Federal Reserve will be holding a policy meeting, the output of which will be very closely watched by an already nervous market, and this could produce strong volatility or directional price movement. There will also be a release of US Advance GDP, the monthly policy release from the Bank of Canada, and Australian CPI (inflation) data.
Last week saw the global number of confirmed new coronavirus cases rise to its highest level ever seen, with over 3.7 million new daily infections confirmed last Thursday. Approximately 60.4% of the global population has now received at least one vaccination.
The strongest growths in new confirmed coronavirus cases overall right now are happening in Algeria, Argentina, Armenia, Austria, Bahrain, Bangladesh, Belgium, Belize, Bhutan, Bosnia, Brazil, Bulgaria, Chile, Colombia, Costa Rica, Croatia, Cuba, Czech Republic, Denmark, Estonia, France, Georgia, Germany, Guatemala, Hungary, Iceland, Iraq, India, Israel, Italy, Japan, Jordan, Kosovo, Kuwait, Kazakhstan, Latvia, Liechtenstein, Lithuania, Luxembourg, Moldova, Mongolia, Morocco, Nepal, Netherlands, North Macedonia, Norway, Oman, Pakistan, Panama, Paraguay, Peru, Poland, Portugal, Qatar, Romania, Russia, Saudi Arabia, Serbia, Singapore, Slovenia, Sweden, Switzerland, Ukraine, the UAE, Uruguay, Uzbekistan, and Venezuela.
Technical Analysis
U.S. Dollar Index
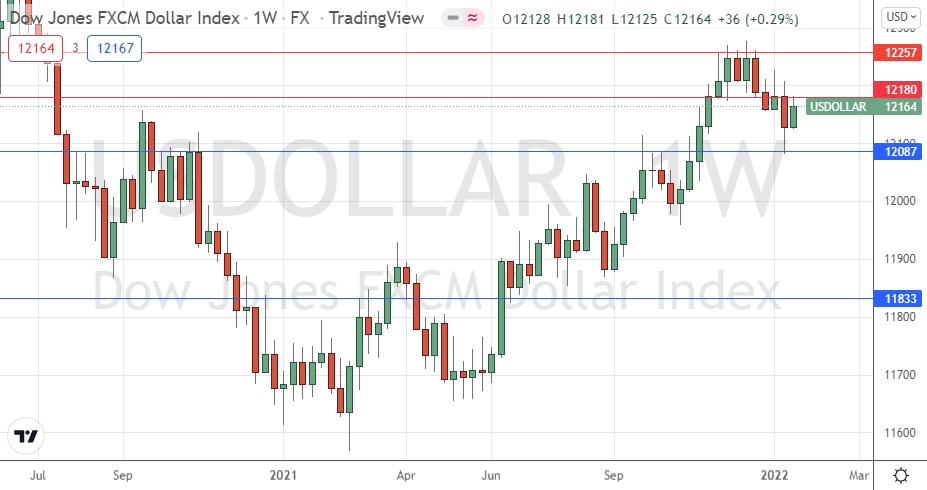
The weekly price chart below shows the U.S. Dollar Index printed a bullish inside candlestick last week, after previously rejecting the support level last week, identified at 12087. Although it is clear there is a short-term bearish trend in the US dollar, this decline is not enough to invalidate the long-term trend (the price is still well above its levels from 3 and 6 months ago). Clues as to the future direction of the US dollar will be whether the index manages to get established above 12180 (bullish) or below 12087 (bearish).
Overall, it seems clear we have a mixed picture in the USD, long-term bullish, medium-term bearish. Therefore, it may be that the main movements in the Forex market over the coming week will not be related to the US dollar, but the FOMC meeting on Wednesday might well change that situation.
WTI Crude Oil
WTI Crude Oil made its highest weekly close in 7 years last week for the second week running but printed a bearish looking pin bar. There are bullish signs, but the pin bar is ominous. Nevertheless, I think WTI Crude Oil can be an interesting buy once if we see a daily (New York) close above $86.52.

BTC/USD
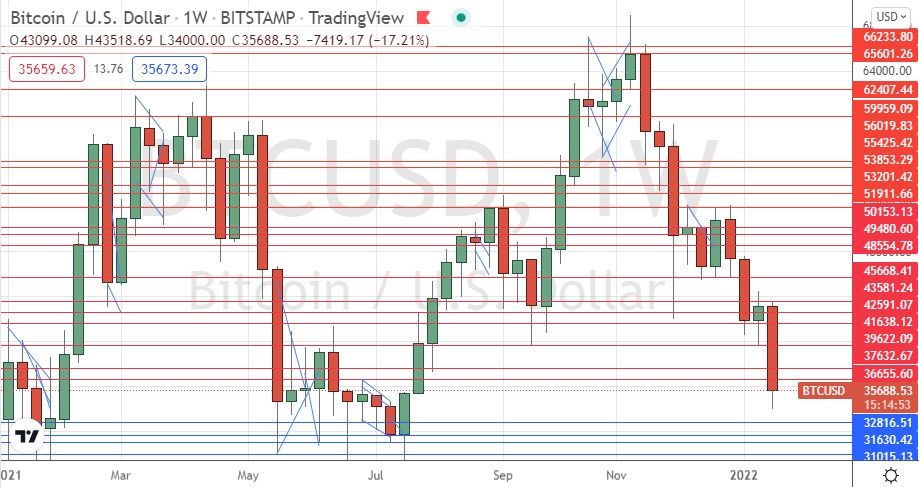
Bitcoin printed a large bearish candlestick last week which broke well below the former support near $40k. This may be very significant and suggest further strong falls over the short-term. The price made its lowest weekly close since July 2021 and the value of Bitcoin has more than halved in the space of barely three months after reaching a record high near $70k in November. It just goes to show that Bitcoin is extremely volatile, and the price of Bitcoin is extremely hard to predict over the long-term: it can go down as well as up!
The price of Bitcoin is likely to fall to touch the support level at $32,817 this week if it remains below the new resistance level at $36,656.
S&P 500 Index
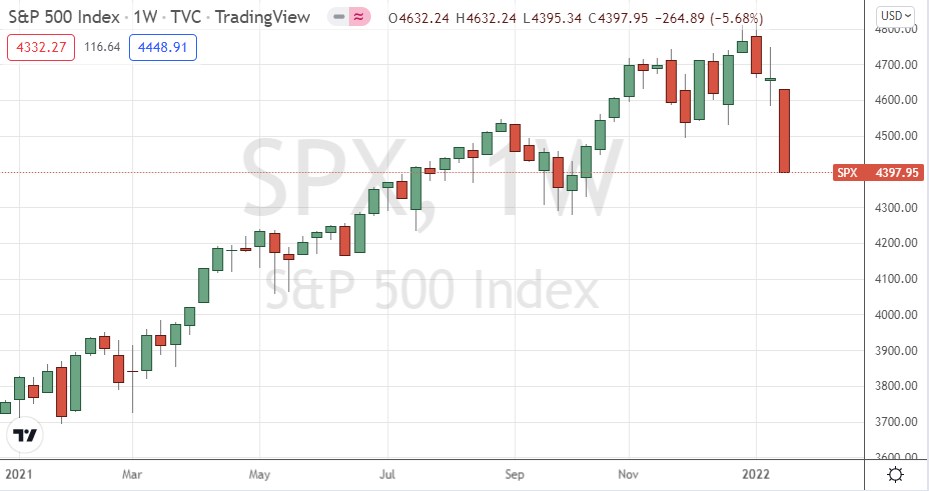
The S&P 500 Index made its strongest weekly fall since October 2020, dropping by more than 200 points and closing right on its low. In the daily price chart, Friday’s close was below the 200-day moving average, which is typically taken as a bearish sign, although a “death cross” by the 50-day below the 200-day moving average has not yet happened.
This could be the end of the bull market we have seen since the summer of 2020. Shorting the S&P 500 Index is dangerous and difficult. If you are considering this, it will probably be best to wait a few more days for an attempted bullish retracement followed by another bearish turn. When shorting this Index, it is often important to be quick to take profits if the price stops acting bearishly.
Bottom Line
I see the best opportunities in the financial markets this week as likely to be long of WTI Crude Oil following a daily (New York) close above $86.52 and short of BTC/USD following a daily (New York) close below $36,656 with a take profit target at $32,817.


