Bullish View
Buy the GBP/USD pair and set a take-profit at 1.3750.
Add a stop-loss at 1.3550.
Timeline: 1-2 days.
Bearish View
Set a sell-stop at 1.3600 and a take-profit at 1.3500.
Add a stop-loss at 1.3700.
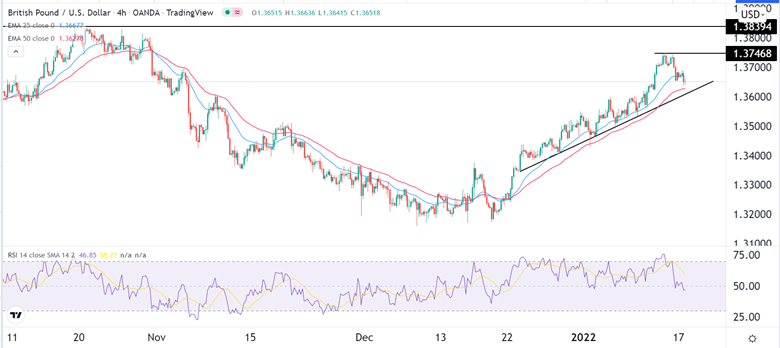
The GBP/USD pair came under pressure as investors prepared for the upcoming economic numbers from the UK. The pair is trading at 1.3650, which is about 0.70% below the highest level last week.
UK Economic Data Ahead
On Friday, the Office of National Statistics (ONS) published strong economic numbers from the UK. These numbers revealed that the country’s economy expanded rapidly in November last year. This happened as companies boosted their fixed asset investments and exports increased. The manufacturing and industrial production sectors also improved during the month.
This week, the ONS will publish additional economic numbers that will provide details about the country’s economy. In the morning session today, the ONS will deliver the latest jobs numbers.
If the trend continues, the data will show that the country’s unemployment rate declined from 4.2% in October to 4.1% or 4.0% in November. At the same time, the number of claimant count is expected to have declined in December.
After the jobs data, the GBP/USD will react to the latest consumer inflation numbers that will come out on Wednesday. Like in the United States, economists expect the data will show that the country’s inflation rose from 5.1% in November to 5.2% in December last year.
Excluding the volatile food and energy prices, they expect that inflation dropped from 4.0% to 3.9%, which will be a sign that inflation is peaking.
Finally, on Friday, the ONS will publish the latest retail sales numbers for December. Recently, most retailers like Tesco, Sainsbury’s, and Marks and Spencer have upgraded their outlook for their holiday shopping period.
The GBP/USD pair has also declined as the political situation in the UK worsens. With the Boris Johnson administration under pressure, there are concerns about how long Johnson will be the prime minister.
GBP/USD Forecast
The four-hour chart shows that the GBP/USD pair formed a strong top at 1.3745 last week. It has dropped by about 0.70% since then. As a result, the pair has moved below the 25-day moving average. But it remains above the 50-day EMA while the Relative Strength Index (RSI) has moved from the extreme overbought zone of 74 to the current 26.
Therefore, the pair will likely resume the bullish trend after the latest UK economic data. Besides, the price is above the ascending trendline shown in black.

