Bearish View
Sell the SOL/USD and set a take-profit at 120.
Add a stop-loss at $160.
Timeline: 2 days.
Bullish View
Set a buy-stop at $145 and a take-profit at $160.
Add a stop-loss at $140.
The Solana (SOL/USD) price sell-off continued during the weekend as concerns about the Fed remained. It is trading at $140, which is about 46% below its all-time high. It has a market capitalization of over $43 billion, making it the fifth-biggest cryptocurrency in the world.
Solana Sell-Off
Like all cryptocurrencies, Solana has not been left behind in the ongoing cryptocurrency sell-off. The decline is mostly because of the changes in monetary policy as the world economy recovers.
Last week, the Federal Reserve published the minutes of its December meeting. These minutes showed that members of the Federal Open Market Committee (FOMC) were more hawkish than expected.
Most of them expect that the bank will accelerate the pace of tightening. This means that the quantitative easing policy is expected to end by March. After this, the bank will start hiking interest rates by about 0.25%.
Solana, like other risky assets, tends to do well in a period of low-interest rates, which explains why it has underperformed in the past few weeks.
Another reason for the weak performance is the regular outages and attacks. Last week, the network suffered another denial of service (DDoS) attack. The attack meant that users of the platform could not access it for a few hours. These attacks could push more developers to other platforms that are equally good like Kadena, Binance Smart Chain, and Terra.
Meanwhile, the Solana price is falling as the total value locked (TVL) of its decentralized finance (DEFI) ecosystem declines. According to DeFi Llama, there are 42 DeFi apps built in Solana’s network. These apps have a TVL of over $9.8 billion. At their peak in December, these apps had more than $15 billion in TVL.
Solana Price Forecast
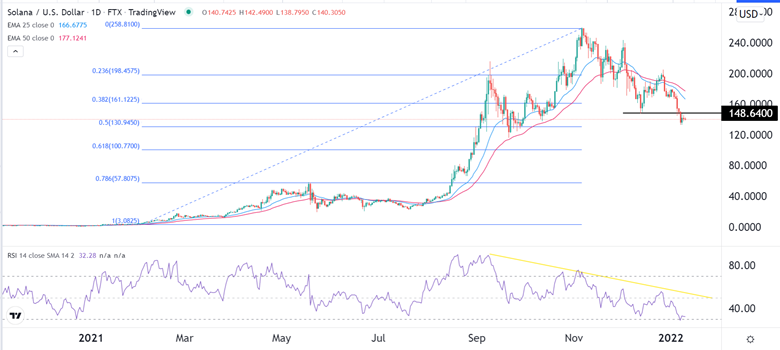
The daily chart shows that the SOL price has been in a strong bearish trend in the past few months. Along the way, the coin has moved close to the 50% Fibonacci retracement level. It has also moved below the 25-day and 50-day moving averages while the Relative Strength Index (RSI) has continued falling, It also declined below the key support at $148, which was the lowest level on December 14th.
Therefore, the pair will likely keep falling as sellers target the next key support at $120, which is along the 50% retracement level.

