Bullish View
- Buy the AUD/USD pair and set a take-profit at 0.7250.
- Add a stop-loss at 0.7100.
- Timeline: 1-2 days.
Bearish View
- Set a sell-stop at 0.7150 and a take-profit at 0.7100.
- Add a stop-loss at 0.7200.
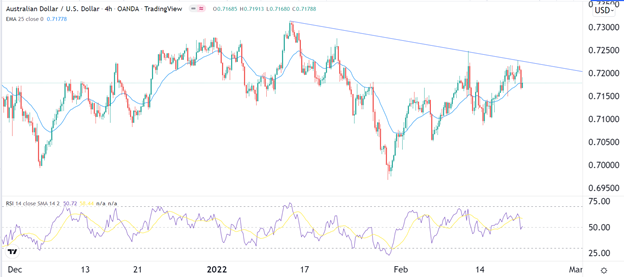
The AUD/USD pair wavered on Monday even after the strong Australian jobs numbers that were published on Thursday. The pair is trading at 0.7178, which is about 70 basis points below the highest level last week.
Australia Wage Growth
The Australian Bureau of Statistics (ABS) published the latest jobs numbers on Thursday last week. The data revealed that the economy created more than 12.9k jobs in January after it added another 64.9k in December. The increase was better than the median estimate of a loss of about 15k jobs.
Further data showed that the unemployment rate remained steady at about 4.2%, which is significantly lower than where it was before the pandemic started. Therefore, analysts expect that the labor market strength will continue, helped by the services sector.
The next key catalyst for the AUD/USD pair will be the closely-watched wage price index (WPI) data. Economists expect the numbers to show that the WPI roe by 2.4% in the fourth-quarter and by 0.7% on a QoQ basis.
Analysts believe that the strength of these numbers will help to determine the next key decisions by the Reserve Bank of Australia (RBA). If the numbers are as strong as expected, they will put the pressure on the RBA to start hiking rates as soon as June. In its most recent decision, the RBA ended its asset purchase program and predicted that the WPI rose at an annual rate of 2.25%.
The other key driver for the pair will be the ongoing crisis on Ukraine. If the tensions keep rising, it could be a sign of more risks in the market, which will lead to a higher demand for US dollars.
AUD/USD Forecast
The four-hour chart shows that the AUD/USD pair has declined sharply in the past few days. A closer look shows that the pair formed a significant descending resistance that is shown in blue. It is also slightly below the 25-day moving average while the Relative Strength Index (RSI) has dropped to the neutral level of 50.
The pair also seems like it has formed an inverted head and shoulders pattern. In price action analysis, the pattern is usually a bullish sign. Therefore, in the long-term, a bullish breakout will be confirmed if the price moves above the blue descending trendline. If this happens, the next key resistance to watch will be at 0.7250.

