Bullish View
- Set a buy-stop at 44,500 and set a take-profit at 46,000.
- Add a stop-loss at 41,000.
- Timeline: 1-2 days.
Bearish View
- Set a sell-stop at 42,500 and a take-profit at 40,000.
- Add a stop-loss at 44,000.
The BTC/USD pair retreated slightly in the overnight session as the strong recovery stalled. The pair is trading at 43,463, which is about 4.50% below the highest level this week. Still, this price is about 32% above the lowest level this year.
Recovery Stalls
Bitcoin and other cryptocurrencies have been in a strong bullish trend in the past few days as investors rushed to buy the dip. The rally also happened as the overall market sentiment improved as evidenced by the fear and greed index.
Analysts attributed the overnight retreat to profit-taking among investors considering that the price has risen by more than 30% from its lowest level this year.
Another possible reason for this price action is the fact that the Nasdaq 100 index also declined. In the past few weeks. Bitcoin has tracked the price of the Nasdaq index considering that the two assets are often seen as being risk assets.
Meanwhile, investors are also waiting for this week’s American consumer price index (CPI). The data is expected to show that the country’s consumer price index (CPI) rose to the highest level in more than 40 years in January.
These numbers will come a few days after the US also published strong jobs numbers. The economy created about 467k jobs in January after adding more than 500k in the previous month. Therefore, with the American labor market being steady and with inflation rising, there is a likelihood that the Fed will continue its hawkish stance this year. Analysts expect that the bank will implement several rate hikes this year.
Historically, Bitcoin tends to underperform in periods of high-interest rates. In a statement, an analyst at Nuveen told Bloomberg that:
“There’s not going to be unlimited liquidity from the Fed anymore, and if we have the money supply contracting, if we have interest rates rising, it will tend to make things like crypto less attractive.”
BTC/USD Forecast
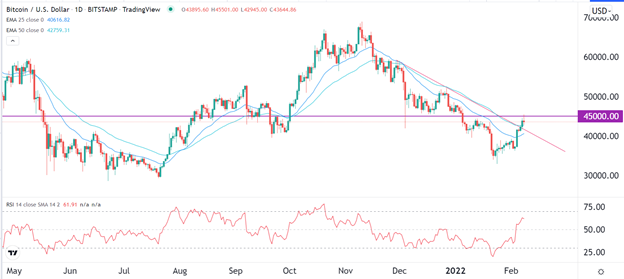
The BTC/USD pair has been in a strong bullish trend in the past few weeks. On the daily chart, the pair managed to move slightly above the descending trend line that is shown in red. The pair also retested the important resistance level at 45,000. Historically, BTC tends to rebalance whenever it hits an important resistance level.
It has also crossed the 25-day and 50-day moving averages while the Relative Strength Index (RSI) has been in a bullish trend. Therefore, there is a likelihood that the pair will resume the bullish trend ahead of the inflation data.

