Bullish View
- Set a buy-stop at 44,000 and a take-profit at 45,000.
- Add a stop-loss at 42,000.
- Timeline: 1-2 days.
Bearish View
- Set a sell-stop at 43,000 and a take-profit at 42,000.
- Add a stop-loss at 44,000.
The BTC/USD price retreated in the overnight session as worries of Russia’s invasion of Ukraine rose. Bitcoin declined to $43,620, which was slightly below this week’s high of 44,755. The decline happened as American indices like the Dow Jones and the Nasdaq 100 also fell.
Bitcoin Retreats
The BTC/USD pair declined after western governments reiterated that Russia was still a threat to Ukraine. The announcement by the US and NATO came a day after the Russian defense ministry said that some of its troops near the Ukrainian border were returning to their home bases. The statement provided calm and confidence by investors, pushing stocks and cryptocurrencies higher.
Bitcoin retreated after the US published strong economic data. The numbers revealed that retail sales did well in January even as inflation remained at elevated levels. Headline inflation rose to a ten-month high of 3.8% while core sales rose to 3.3%.
Other US numbers have been strong as well. For example, the unemployment rate is at 4%, which is significantly lower than the pandemic high of 14%. Inflation, on the other hand, has risen to the highest point in more than 4 decades.
Therefore, it was understandable that the Fed minutes showed that officials were more hawkish. They said that they will likely end the asset purchases in March and then start hiking interest rates immediately. While most members were comfortable with three hikes, others supported more.
The BTC/USD pair also declined after concerns about Bitcoin’s privacy emerged. Two weeks ago, it was revealed that FBI had managed to track funds stolen in the Bitfinex hack. And this week, Canada announced that it was sanctioning 34 Bitcoin wallets that were connected to the anti-vaccine mandates protests.
BTC/USD Forecast
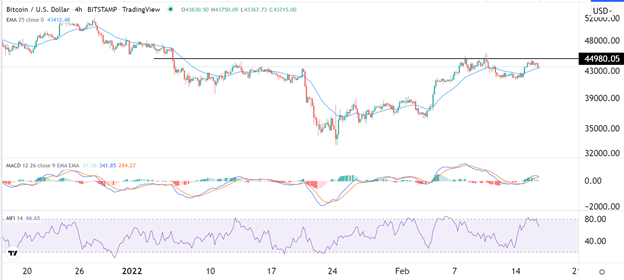
The four-hour chart shows that the BTC/USD pair pulled back slightly during the overnight session. Still, the coin remains slightly above the 25-day and 50-day moving averages. Notably, it has formed an inverted head and shoulders pattern, which is usually a bullish sign. The neckline of this pattern is at 44,980.
The MACD is slightly above the neutral level while the money flow index has moved slightly below the overbought level.
Therefore, the pair will likely have a bullish breakout in the coming days as bulls target the key resistance at 45,000.

