The difference between success and failure in Forex trading is very likely to depend mostly upon which currency pairs you choose to trade each week and in which direction, and not on the exact trading methods you might use to determine trade entries and exits.
When starting the trading week, it is a good idea to look at the big picture of what is developing in the market as a whole and how such developments and affected by macro fundamentals and market sentiment.
The Forex / CFD market is currently showing some trends in certain commodities and stock market indices.
Big Picture 20th February 2022
Market sentiment continues to be dominated by the Russian military buildup on Ukraine’s borders and higher than expected CPI (inflation) data emerging from G7 nations. This has broadly produced bearish pressure on stock markets and bullish pressure on commodities, including Gold.
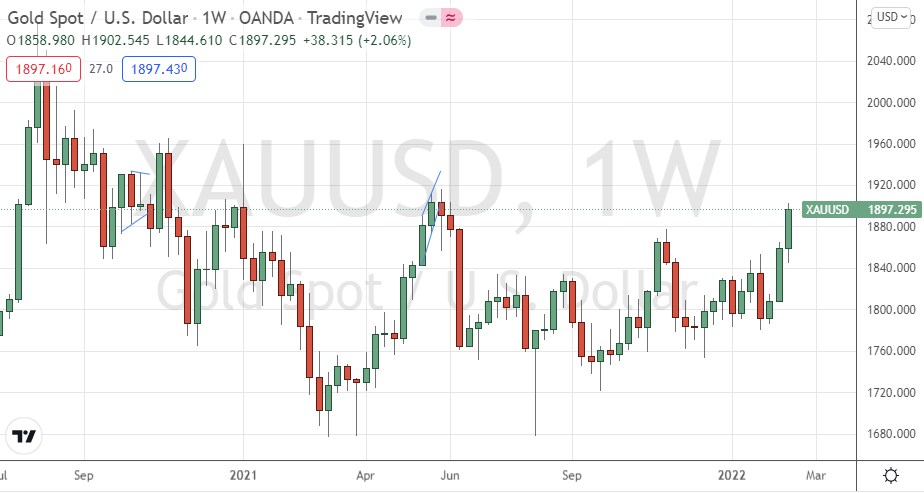
The Forex market moved little last week, but some soft commodities such as Soybeans and Corn remain very bullish and close to long-term highs, while Gold traded at a 6-month high above $1,900.
Last week was the fourth consecutive week in which the number of new global confirmed coronavirus cases fell.
I wrote in my previous piece last week that the best trades for the week were likely to be WTI Crude Oil and Corn, also Soybeans following a close above $26.87. Although the Teucrium Corn ETF rose by 1.07%, WTI Crude Oil fell by 2.00%, so this gave an averaged loss of 0.47% for the week.
Fundamental Analysis & Market Sentiment
The headline takeaways from last week were the continuing increase in G7 inflation (CPI data from the UK and Canada showing 30-year highs) and the prospect of war between Russia and Ukraine. President Biden has stated he believes a Russian attack is likely in the coming days. This is causing some risk-off sentiment and is probably boosting the prices of certain commodities. Commodities also tend to perform well in high-inflation, low real interest rate environments such as we are experiencing now, which is likely why we are seeing the price of Gold reach a 6-month high.
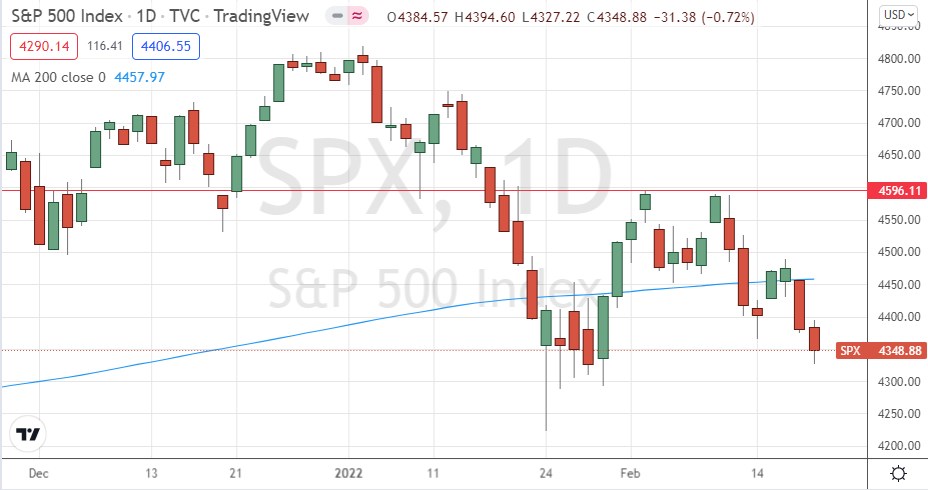
It should also be noted that the past week has been bad for almost all major stock indices, with the S&P 500 Index exhibiting a firmly bearish technical pattern of lower lows and highs. The Index is trading below its 200-day moving average, which is typically a bearish sign.
The coming week is likely to see a lower or similar level of volatility compared to last week, with markets seeing strong commodities, especially in precious metals, energies, and agriculture, under an overlying theme of high inflation and negative real interest rates. However, if Russia does invade Ukraine, this will likely produce dramatic movements in the market. Additionally, there are a few economic data releases due this week, in order of importance:
US Preliminary GDP
US Core PCE Price Index
UK Monetary Policy Report Hearings
Reserve Bank of New Zealand Official Cash Rate & Monetary Policy Statement
Last week saw the global number of confirmed new coronavirus cases fall again for the fourth consecutive week. Approximately 61.9% of the global population has now received at least one vaccination.
The strongest growths in new confirmed coronavirus cases overall right now are happening in Belarus, Bhutan, Burma, Cambodia, Chile, Guatemala, Iceland, Indonesia, South Korea, Latvia, New Zealand, Russia, Singapore, Slovakia, Thailand, Tonga, and Vietnam.
Technical Analysis
U.S. Dollar Index
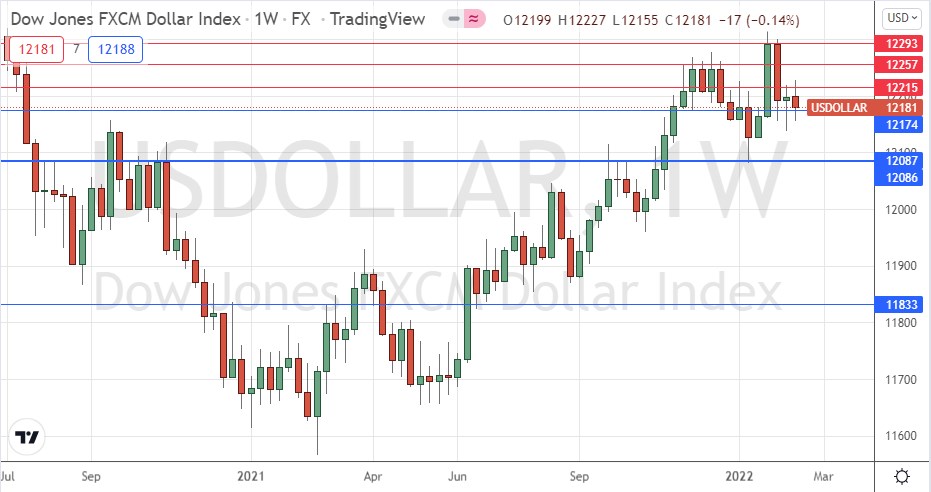
The weekly price chart below shows the U.S. Dollar Index printed a near-doji candlestick which was also technically a bearish engulfing candlestick last week, as the price continued its consolidation between the support level at 12086 and the resistance level at 12293. The price is obviously consolidating but there is still a long-term bullish trend in force, with the price higher than where it was 6 months ago, and just barely higher than it was 3 months ago which means the bullish trend is close to ending.
However, if the support level at 12086 continues to hold, the long-term bullish trend will be likely to resume.
Overall, it seems clear we still have bullish picture in the USD over the long and medium terms, but in the Forex market the greenback seems to not be the main driver of prices right now. It may be a better time to trade currency crosses not involving the USD.
Gold
It is likely that the bullish momentum we see here is driven by increasingly high inflation in G7 nations and by the prospect of a war between Russian and Ukraine breaking out.
Real negative interest rates and geopolitical instability makes Gold look attractive. However, bulls may need to beware of the potential inflection point just above the current price at $1,917 and of course the very major round number at $2,000 either or which could halt the advance.
S&P 500 Index
After a long bull market, the US stock market has fallen into correction territory since the start of 2022, falling by more than 10% in value from its all-time high price. Despite making a recovery two to three weeks ago, the price is again trading below its 200-day moving average, which is a bearish sign. The 50-day moving average, which is not shown, is close to making a moving average crossover below the 200-day moving average. This “death cross” which is extremely likely to happen soon, will be another bearish sign.
The price chart below also shows a very clear resistance level which has been printed at 4596.11.
Stocks are depressed by the high inflation environment, and even more by the prospect of imminent war between Russia and Ukraine.
I do not recommend going short of a major stock market index for novice traders, but it is certainly a bad idea to go long in this picture.
Soybeans
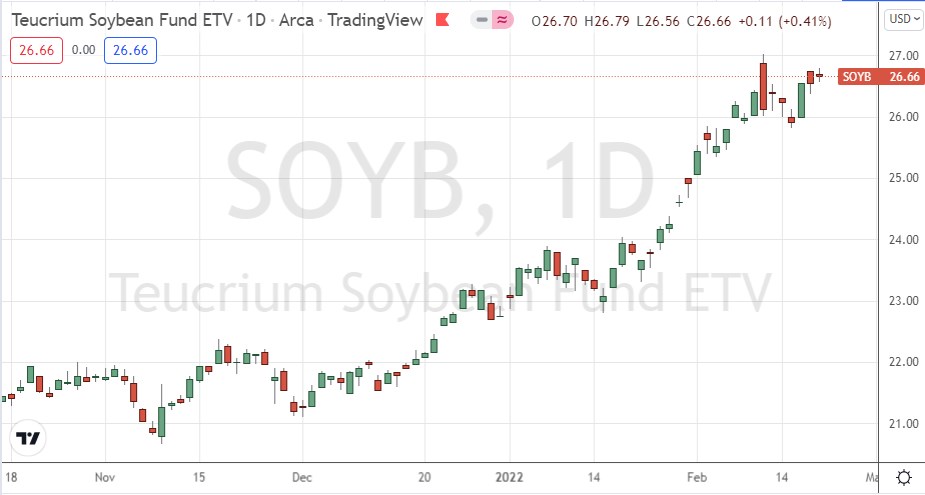
The prices of several agricultural “soft” commodities have been rising strongly in recent weeks, arguably driven by higher inflation rates and negative real rates of interest which we are seeing across many countries.
The week before last ended with the highest weekly close in seven years.
It makes sense to look for long commodity trades during this period of high inflation, although be aware that volatility of soft commodities can be very high, so it is important to trade these in relatively small position sizes.
I see soybeans as an interesting buy if this ETF can make a daily close this week above $26.87.
Corn
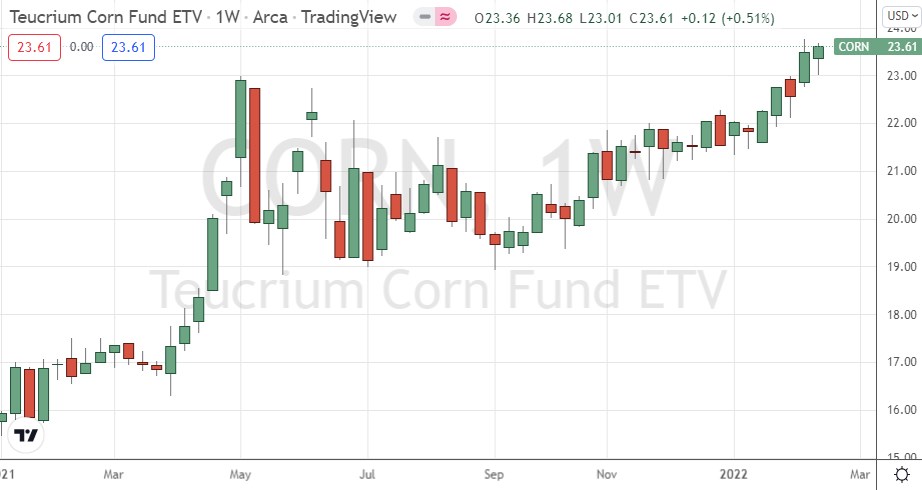
Along with soybeans, corn has risen strongly in price lately, but even more firmly. Last week’s price rise produced a bullish inside candlestick after the previous week had seen the highest weekly close in five years, and the price ended the week near the high of the week’s price range.
I see corn as an interesting buy right now, as commodities that are relatively inelastic like foodstuffs such as corn, tend to do well in high-inflation environments such as we have today.
Bottom Line
I see the best opportunities in the financial markets this week as likely to be long of Gold and Corn, also Soybeans following a close above $26.87.

