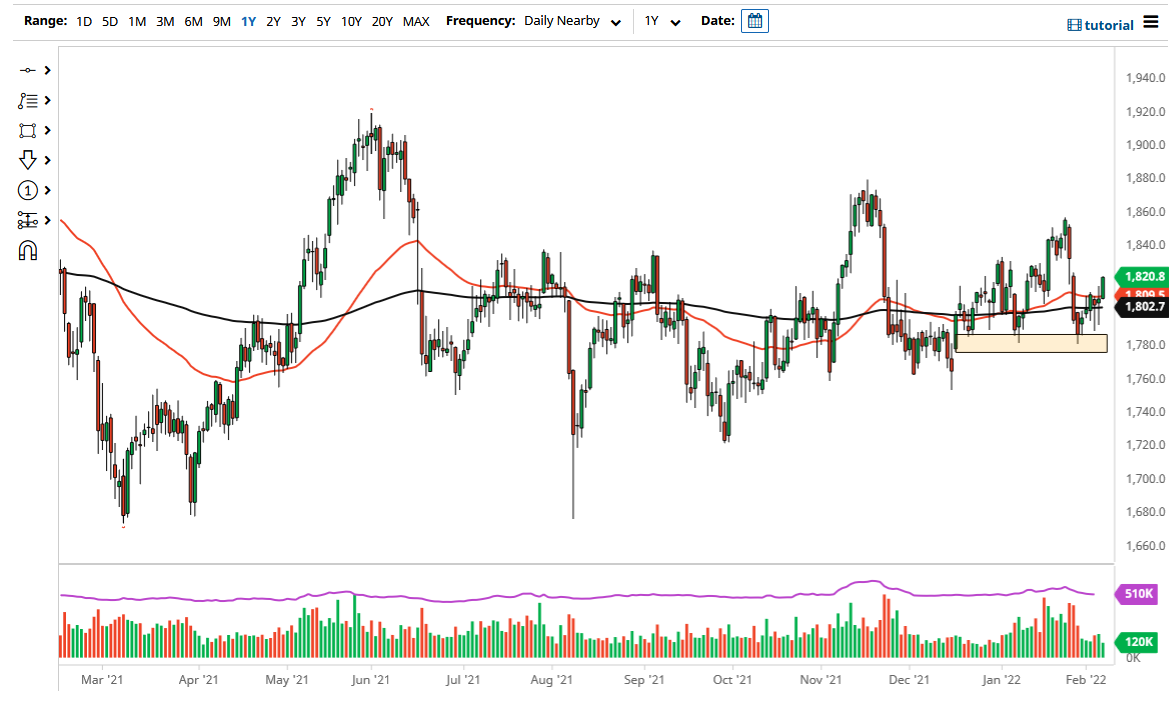
Gold markets clearly broke out to the upside on Monday, clearing the resistance barrier from the last several days. Keep in mind that the Friday candlestick was a complete turnaround after a massive selloff early, and this does suggest that perhaps we are going to continue to see plenty of money flow into the gold market. Furthermore, we also have the gap above that needs to be filled, so I do think that we may try to do that over the next couple of days.
The shape of the candlestick is something worth paying attention to, and the fact that we closed towards the top of it does suggest that we have further to go. I think at this point time any short-term pullback is probably going to be bought into, as the market has clearly changed its attitude, at least in the short term. This is not to say that we cannot break down from here, just that we probably have plenty of people noticing this behavior. Because of this, I think we will probably have some volatility, but I think the 50 day EMA is going to offer a significant amount of support.
Looking at this chart, you can see that there is a clear support level underneath at the $1780 level, which has held up quite nicely for a while. If we were to break down below there, it would change everything, but right now it does not look like we are anywhere near testing that, nor does it look like we are suddenly going to get bearish. Because of this, I have to assume that short-term pullbacks will be buying opportunities. On the other hand, we could just simply break above the top of the range from the trading session on Monday, and that almost certainly means that we will go higher to fill the gap. At this point, gold is also the favorite trade of a lot of other traders around the world as we start to worry about inflation. Longer term, I believe that gold is a short-term buy, but if we were to blow through that gap then we have to start to think about the idea of gold taking off and breaking above the highs that we recently put in. Either way, I would be expecting a lot of noise on short-term charts.

