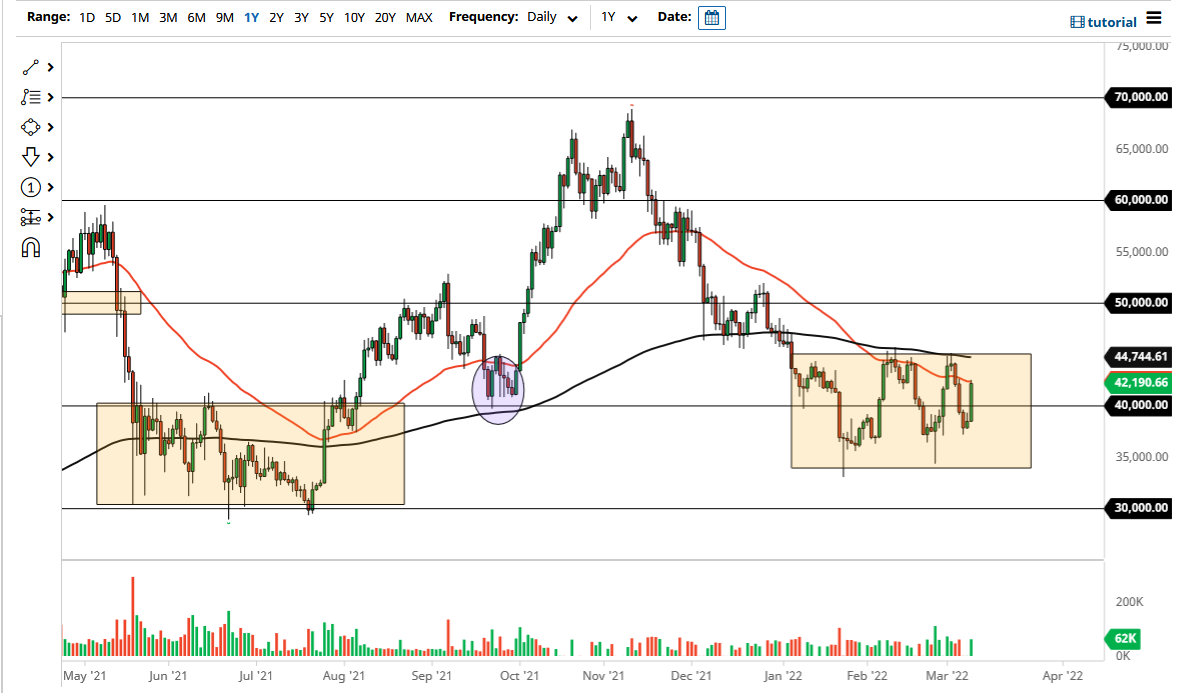
The Bitcoin market broke higher during the course of the trading session on Wednesday to reach towards the 50 Day EMA. This is an area that causes a little bit of technical resistance, and somewhere between here and the 200 Day EMA, we will see quite a bit of selling pressure. After all, Bitcoin remains somewhat in a downtrend, or at the very least consolidation. The question now is whether or not this consolidation will lead to some type of move to the upside?
What is worth paying the most attention to is the 200 Day EMA, as it sits just below the $45,000 level. The $45,000 level of course is an area that has acted as a barrier for quite some time, and as a result, it is not a huge surprise to see sellers coming back in near this region. If we break above there, then it is possible that we could go looking towards the $50,000 level. The $50,000 level is an area that will get a lot of headline attention, and therefore it does make a certain amount of sense that we would see a bit of a barrier there.
On the downside, the $35,000 level would be a major support level that being broken would be a big turn of events. At the moment, looks like Bitcoin is trying to consolidate a bit and could be stabilizing enough for people to jump back in. However, monetary policy is going to be a major driver of where we go next, and it should be noted that there is a very important Federal Reserve meeting early next week. In other words, it could be comments coming out of Jerome Powell that will move Bitcoin next. The size of the candlestick does suggest that there are people out there looking to get involved, but it should also be noted that the US dollar got hammered during the day in a bit of profit-taking.
I do believe that unless Bitcoin rallies significantly, it is very likely that the entire crypto world will continue to be lackluster at best. It is because of this that even if you are not trading in Bitcoin, you probably should keep an eye on this chart to give you an idea as to what risk appetite will look like in general.

