Previous BTC/USD Signal
My previous signal on 17th March was not triggered, as none of the key levels identified were reached that day.
Today’s BTC/USD Signals
Risk 0.50% per trade.
Trades must be entered prior to 5pm Tokyo time Friday.
Long Trade Ideas
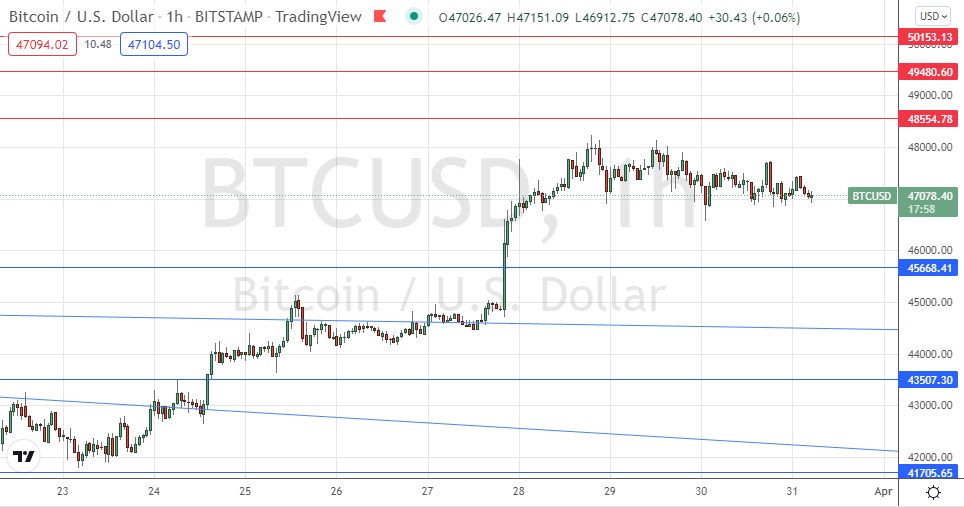
- Go long after a bullish price action reversal on the H1 timeframe following the next touch of $45,668 or $43,507.
- Place the stop loss $100 below the local swing low.
- Adjust the stop loss to break even once the trade is $100 in profit by price.
- Take off 50% of the position as profit when the trade is $100 in profit by price and leave the remainder of the position to run.
Short Trade Ideas
- Short entry after a bearish price action reversal on the H1 timeframe following the next touch of $48,555, $49,481, or $50,153.
- Place the stop loss $100 above the local swing high.
- Adjust the stop loss to break even once the trade is $100 in profit by price.
- Take off 50% of the position as profit when the trade is $100 in profit by price and leave the remainder of the position to run.
The best method to identify a classic “price action reversal” is for an hourly candle to close, such as a pin bar, a doji, an outside or even just an engulfing candle with a higher close. You can exploit these levels or zones by watching the price action that occurs at the given levels.
BTC/USD Analysis
I wrote on 17th March that the price was most likely to chop around for the time being between $37,179 and $41,993.
This was an accurate call, but as none of my key levels were reached by the price that day, no trade entry signals were generated.
The technical picture has changed since then. First, a few days ago, there were some bullish developments: the price broke out past a couple of major resistant descending trend lines and reached multi-week highs.
However, over the past few days, the price has been slowly descending in a bearish consolidative pattern a short way below the key resistance level at $48,555. The price action looks distributive, so overall the technical evidence suggests that the price is now due a slow fall to at least the nearest support level at $45,668.
I am prepared to take a long trade later from a bullish bounce at $45,668 if it happens, but I would be conservative about profit and monitor the trade on a shorter time frame.
A short trade from a bearish reversal at $48,555 could also be an opportunity but looks very unlikely to happen today. Concerning the USD, there will be a release of Core PCE Price Index data at 1:30pm London time.
