Bearish View
- Sell the BTC/USD pair and set a take-profit at 38,000.
- Add a stop-loss at 40,500.
- Timeline: 1 day.
Bullish View
- Set a buy-stop at 40,300 and a take-profit at 42,000.
- Add a stop-loss at 38,000.
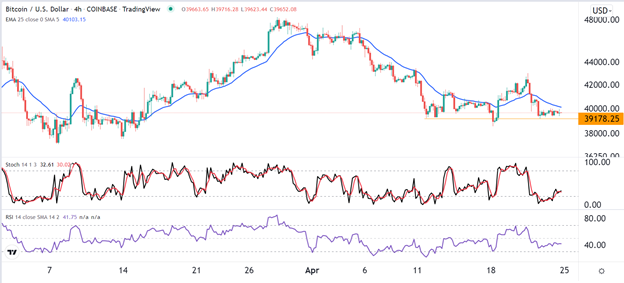
The BTC/USD pair moved sideways during the weekend as sentiment in the financial market waned. The pair remained slightly below the 40,000 support level. It has crashed by over 17% from its highest level this month.
Market Mood Dampens
The BTC/USD pair declined sharply on Friday as worries about the Federal Reserve continued. As a result, Bitcoin’s performance mirrored that of other assets. For example, the bond sell-off in the United States continued, pushing the 10-, 30-, and 2-year yields rising to the highest points in years. Similarly, stocks declined sharply, with the Dow Jones shedding over 1,000 points.
The performance is mostly because of multiple statements by Federal Reserve officials. For example, in a meeting organized by the IMF, Jerome Powell reiterated that the American economy was doing great. As a result, he insisted that the bank will continue hiking interest rates in the coming months. The same view was shared by other officials like Mary Daly and James Bullard.
In most cases, Bitcoin and other risky assets tend to underperform in a period of high rate hikes. Besides, low-interest rates and an expanding balance sheet were the main causes of the recent Bitcoin and stocks rally.
A close look at data compiled by CoinGlass shows that most traders in the derivatives market believe that they expect that the downward trend will continue. Funding rates in these exchanges have been firmly negative. Further data revealed that inflows into Bitcoin have remained being sluggish in the past few days. This signals that demand is a bit limited.
Meanwhile, the Bitcoin fear and greed index shows that investors are still fearful about the market. It has moved to the extreme fear zone of 24. The fear and greed index tracked by CNN Money has moved to the fear level of 30.
BTC/USD Forecast
The four-hour chart shows that the BTC/USD pair has been under pressure in the past few days. It is stuck below 40,000 and is slightly above the key support level of 39,000. A closer look revealed that it has moved slightly below the 25-day and 50-day moving averages. It has also formed a small head and shoulders pattern. Another bearish pattern is the bearish flag.
Therefore, there is a likelihood that the pair will likely keep falling as bears attempt to move below last week’s low at 38,500.

