Bearish View
- Sell the BTC/USD pair and set a take-profit at 40,000.
- Add a stop-loss at 45,000.
- Timeline: 1-2 days.
Bullish View
- Set a buy-stop at 43,000 and a take-profit at 45,000.
- Add a stop-loss at 41,000.
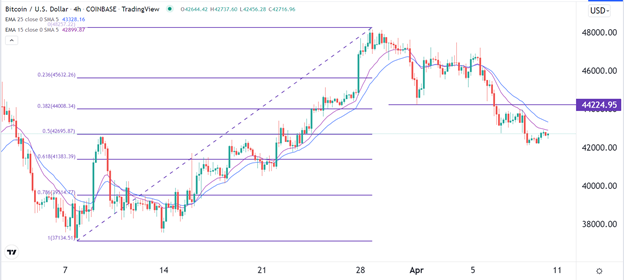
The BTC/USD pair lost its bullish momentum as fears of a more hawkish Federal Reserve coincided with falling on-chain activity. It declined to a low of 42,088, which was the lowest level since March 23rd. It has fallen by more than 12% from its highest level this month.
Falling On-Chain Activity
Bitcoin and other assets like stocks declined last week as concerns about the inverted yield curve continued. The curve inverted to the lowest level in more than 15 years as investors remained concerned about the Federal Reserve.
Minutes published by the bank showed that the bank was considering implementing more rate hikes this year. It also pointed to the upcoming quantitative tightening. Therefore, investors are concerned about a potential recession. Historically, the yield curve has been one of the best indicators of recessions.
Meanwhile, on-chain data reveals that activity in Bitcoin’s activity has started falling. Data compiled by the Block showed the number of new addresses, which rose in March, has started falling. The same is true with the adjusted on-chain volume. Transaction fees in the network have also declined sharply in the past few weeks.
The next key catalyst for the BTC/USD pair will be the upcoming American inflation that is scheduled for Wednesday this week. Analysts expect the data to show that inflation continued soaring in March as the crisis in Ukraine continued.
Bitcoin investors will also start to focus on the upcoming quarterly earnings by leading American banks. The banks to watch this week will be JP Morgan, Citigroup, and Wells Fargo. Giant companies like Blackrock will also publish their results. These earnings are usually important because investors focus on potential statements about cryptocurrencies.
BTC/USD Forecast
The BTC/USD pair has been in a strong bearish trend in the past few days. The coin has managed to move below the support level at 44,225, which was the lowest level on April 1. It has also dropped to the 50% Fibonacci retracement level. The pair has also dropped below the 25-day and 50-day moving averages. Notably, it has also formed what looks like a bearish flag pattern.
Therefore, the pair will likely keep falling as bears target the next key support level at 40,000. A move above the resistance at 43,500 will invalidate the bearish view.

