The difference between success and failure in Forex trading is very likely to depend mostly upon which currency pairs you choose to trade each week and in which direction, and not on the exact trading methods you might use to determine trade entries and exits.
When starting the trading week, it is a good idea to look at the big picture of what is developing in the market as a whole and how such developments and affected by macro fundamentals and market sentiment.
There are a few strong trends in the markets, so it is an interesting time to be trading.
Fundamental Analysis & Market Sentiment
I wrote in my previous piece last week that the best trade for the week was likely to be long of USD/JPY. This was a good call as USD/JPY rose by 0.37% over the week.
The news remains dominated by the Russian invasion of Ukraine which is now well into its sixth week. Ukraine is having success driving Russian force back from Kiev, while Russian forces focus on the south and east of Ukraine. However, the war no longer seems to be having much impact on markets, but that may change quickly if reports that the two sides are getting close to the terms of a ceasefire, excepting the Crimea issue, are proven to be correct soon. This news could be expected to boost stocks and see energies and agricultural commodities decline.
Despite the worrying conflict in Ukraine, markets have continued their shift towards a risk-on sentiment and pattern over the past week, with stock markets mostly rising and currencies mixed. This can probably be explained by three factors:
Markets have recovered from the initial shock of the Russian invasion of Ukraine, which is now seen as unlikely to spiral into a wider conflict, or even to end in any kind of Russian victory. This view is boosted by the fact that Russia and Ukraine are continuing what seem to be more serious peace talks with some reports that the parties are not far from an agreement.
Continued robust jobs and wages growth in the US, which suggests that economic fundamentals are sound apart from rising inflation at a 40-year high and consumer sentiment at an 11-year low, which surprisingly (with the newly inverted rate curve) has not been enough to trigger a further slide in the US stock market. The Federal Reserve is signaling ongoing rate hikes will continue and an increasing pace to the withdrawal of all remaining monetary stimulus.
Despite the relatively bullish price movements in stock markets, it should be noted that the S&P 500 index is languishing very close to its 200-day moving average, suggesting more consolidative than bullish price behavior.
In other news last week:
The 2 and 10-year US Treasury yield curve inverted last week for the first time since 2006. This is traditionally seen as an indicator of an impending recession, so is usually negative for stock markets. However, most analysts do not see this as a likely outcome currently.
US unemployment fell from 3.8% to 3.6%, less than the rate of 3.7% which had been expected, although the net new non-farm payrolls came in a bit lower than had been expected.
The US Core PCE Price Index data came in as expected with a month on month increase of 0.4%, giving some hope of easing inflationary pressure.
Canadian GDP data came in as expected, showing a month on month increase of 0.2%.
Last week saw the global number of confirmed new coronavirus cases decline for the second consecutive week. Approximately 64.5% of the global population has now received at least one vaccination, and 6.2% are known to have contracted the virus.
The strongest growths in new confirmed coronavirus cases overall right now are happening in Australia, Bhutan, Cyprus, France, Laos, Luxembourg, Malta, Monaco, Samoa, Taiwan, and Thailand.
The Week Ahead: 4th – 8th April 2022
The coming week in the markets is likely to be dominated by continuing normalization of volatility and directional price movement. We have seen the Japanese Yen regain some if its value after USD/JPY peaked at about ¥125.
We have a few high-impact economic data releases due this week, in order of probable importance:
US FOMC Meeting Minutes
RBA Cash Rate and Rate Statement
US ISM Services PMI data
Canadian Employment Change / Unemployment Rate
Technical Analysis
U.S. Dollar Index
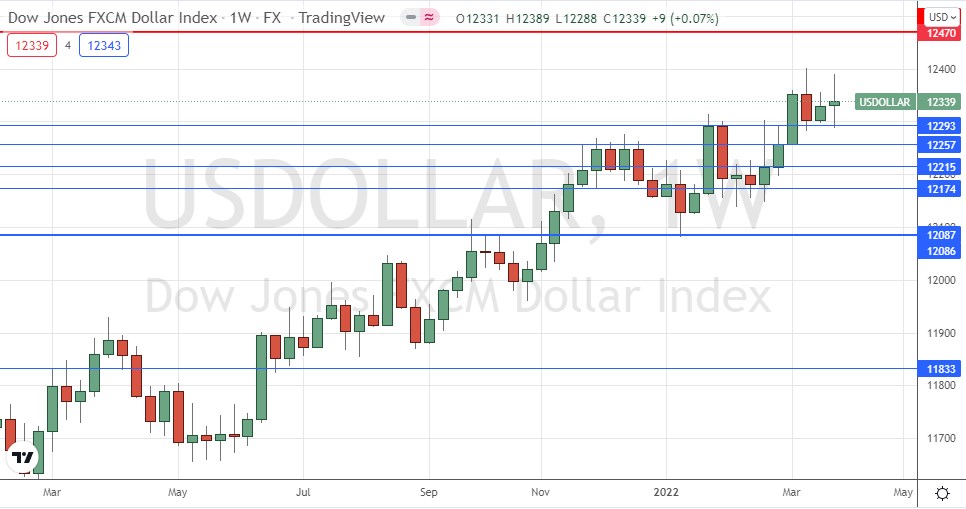
The weekly price chart below shows the U.S. Dollar Index rose slightly last week, in line with the long-term bullish trend, printing a bullish doji candlestick, which can be a sign of indecision. However, the lower wick was supported by 12293, so if the price can break last week’s high over the coming week, it will be a bullish sign Dollar bulls will be encouraged that the nearest support level, shown in blue at 12293 within the below price chart, has continued to hold, giving hope that the greenback will resume its advance more strongly.
It may be wise to take trades in favor of the US Dollar in the Forex market over the coming week.

S&P 500 Index
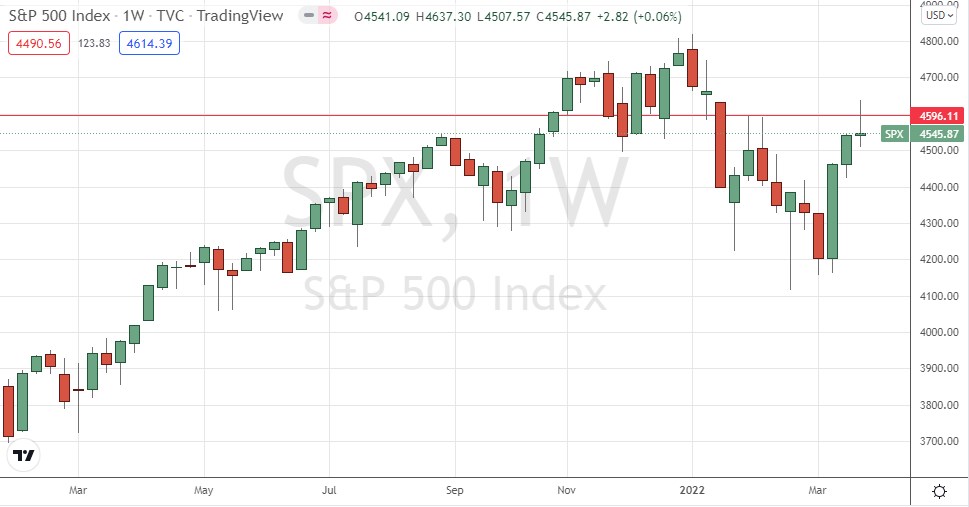
The world’s most important stock market index, the S&P 500, rose again last week, despite three weeks ago making the first “death cross” / “bear cross” (50 day moving average crosses below the 200-day moving average) seen since the coronavirus shock of March 2020.
The price closed Friday very slightly higher on the week, just a little way back above the 200-day moving average, but still below the key resistance level marked on the weekly price chart below at 4596. Note that the weekly candlestick is a pin bar rejecting a resistance level, which is usually a bearish sign. There are also prevailing signs of consolidation. I see the US stock market as an uncertain trade right now due to signs of deteriorating consumer demand and a tightening monetary policy from the Federal Reserve. Long day trades on strong short-term momentum may be the best strategy here over the coming week.

USD/JPY
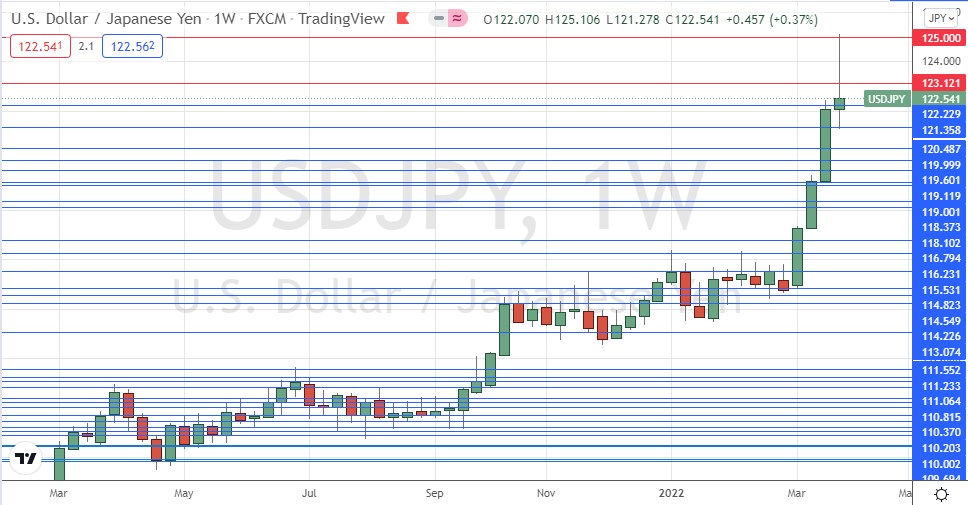
The USD/JPY rose very strongly over the past few weeks, eventually peaking the week before last at its highest closing price seen in over 6 years above ¥125. The past week saw the price come off these highs and slowly begin to consolidate on diminishing volatility.
There is a reason to keep looking to the bullish side after such a strong price movement, and public declarations from the Bank of Japan suggesting they could tolerate the price rising as high as ¥130 before intervening.
The best way to judge whether this pair is going to make another significant rise is to watch whether we can get a daily New York close above the key resistance level at ¥123.12. I will not take a long trade until that hurdle is overcome. The fact that last week’s candlestick was a pin bar is another reason to be cautious.

Bottom Line
I see the best opportunities in the financial markets this week as likely to be long of USD/JPY, following a daily (New York) close above ¥123.12.
