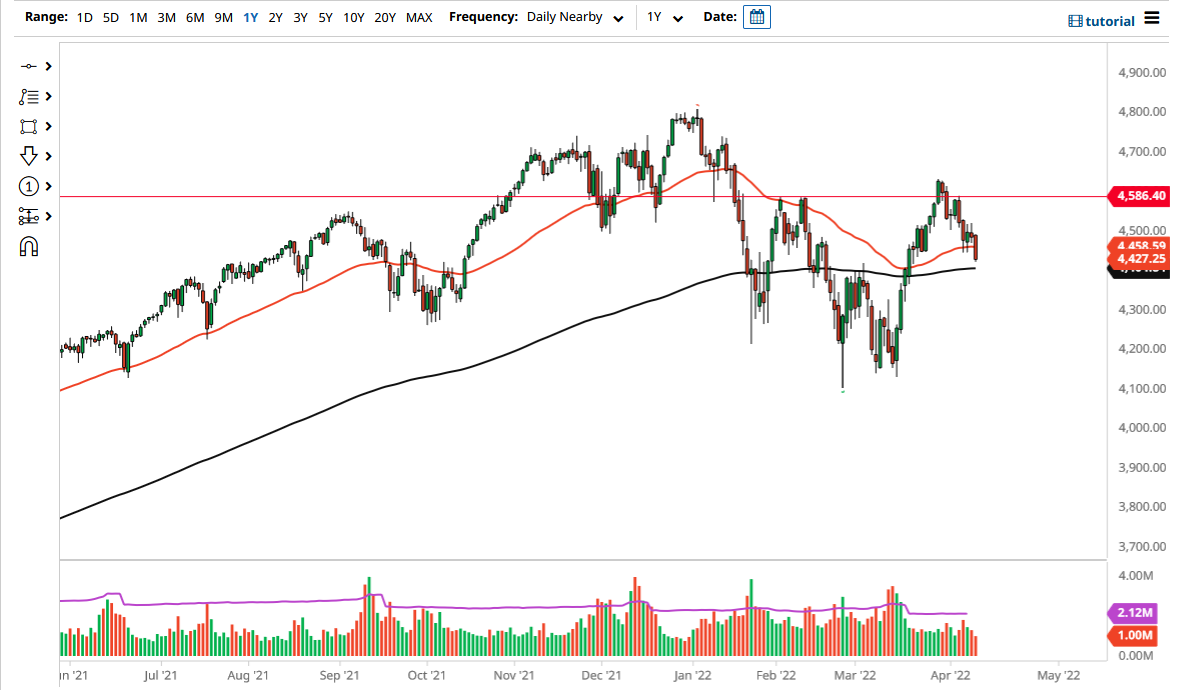
The S&P 500 futures market fell on Monday to slice through the 50-day EMA. That being said, the market is likely to go looking toward the 200-day EMA. The 200-day EMA is quite often used as a symbol of whether or not we are in an uptrend or a downtrend. As we break below it, it is likely that we would see more money flowing out of the market and perhaps even shorting it.
The size of the candlestick is much bigger than several previous days, and the fact that we are closing at the bottom of the range for the day, it is likely that we will see a bit of follow-through. If we do get that follow-through, is very likely that the market will break below that 200-day EMA, perhaps reaching the 4300 level, maybe even the 4200 level after that.
The market has been rather noisy as of late, and now I look at this chart and I wonder whether or not we are trying to form some type of larger trading range? The top of it would be close to the 4585 level, with the 4150 level offering support. If we were to break it down below that, it could have a major negative effect on the market, perhaps causing a massive meltdown. I do not necessarily believe that will happen, but pay close attention to the interest rate sector in the United States, because as it increases, it weighs upon the stock market.
Alternately, if we were to break above the top of the range for the trading session and perhaps even the 4500 level on a daily close, it is likely that we could go looking towards the 4585 level. This is a market that I think will continue to be very noisy, but the fact that we closed the way we did suggests to me that we have further to go to the downside. I do not like the look of this candlestick, and I think we will continue to see more or less a “fade the rally” type of attitude here. Expect volatility, and as the VIX is rising, that will only be yet another reason to think that this market will continue to fall.

