Bullish View
- Set a buy-stop at 30,500 and a take-profit at 32,000.
- Add a stop-loss at 27,500.
- Timeline: 2 days.
Bearish View
- Set a sell-stop at 28,700 and a take-profit at 27,000.
- Add a stop-loss at 31,000.
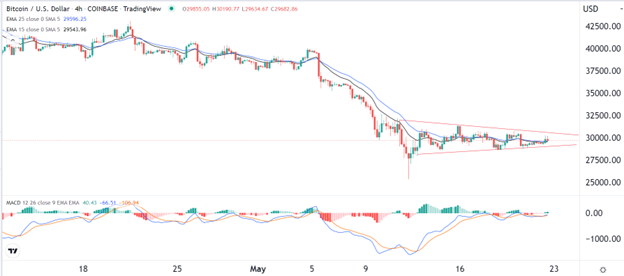
The BTC/USD price is still in a tight range as investors watch the overall market sentiment. Bitcoin is trading at $29,897, which is in the same range it has been in the past few days. This price is about 17% above the lowest level this month.
Fear and Greed Retreats
The BTC/US pair has been moving sideways in the past few days as investors remain pessimistic and fearful about the market. The fear and greed index has declined to the extreme fear level of 11, which explains why both stocks and cryptocurrencies have declined sharply.
The latest cause of fear was the ongoing margin compression in the United States after the recent results by Target, Walmart, and Kohls. All these retailers said that their profit margins have thinned sharply in the past few months as the cost of doing business rose.
As a result, shares of most retailers have plummeted in the past few days, with Target falling by 29% in the past five trading sessions. Walmart shares plummeted by 19% while Kohls fell by 20%.
These companies are important because of the special role that consumer spending has on the American economy. As a result, their results helped to push the Dow Jones and Nasdaq 100 indices sharply lower, with the S&P 500 hovering above its bear market level.
All these factors have an impact on the BTC/USD pair because of the ongoing correlation between stocks and digital currencies.
Meanwhile, recent options data show that the decline has more room to run. The put/call ratios for bitcoin open interest has jumped to the highest level in 12 months of 0.72. This is a signal that investors are still more bearish since investors are anticipating that the sell-off will continue.
BTC/USD Forecast
The BTC/USD pair remained in a consolidation mode. It is trading at 29,700, where it has been in the past few days. It has formed a symmetrical triangle pattern that is shown in red. Also, the pair has moved to the 25-day and 50-day moving averages while the MACD indicator has moved slightly below the neutral level.
Therefore, the pair will likely consolidate in this range today. Later this week, a strong bullish or bearish breakout cannot be ruled out. If this happens, the key support and resistance levels to watch will be at 28,500 and 30,770.

