Bullish View
- Buy the BTC/USD pair and set a take-profit at 31,000.
- Add a stop-loss at 28,000.
- Timeline: 1-2 days.
Bearish View
- Set a sell-stop at 28,400 and a take-profit at 27,000.
- Add a stop-loss at 20,000.
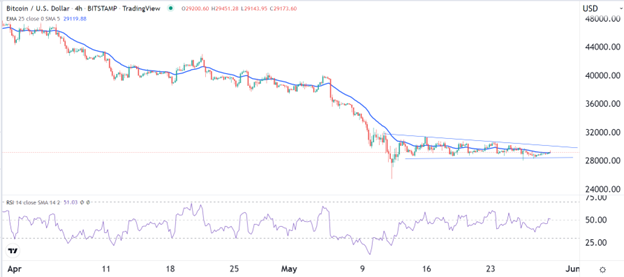
The BTC/USD price remained in a tight range as the pair continued to decouple from American stocks. It is trading at 29,210, where it has been in the past few days. This price is about 15% above the lowest level in May this year.
Bitcoin and Stocks Decoupling
Bitcoin and American stocks have been having a strong correlation in the past few months. This has meant that the two assets have moved in the same direction.
Recently, however, Bitcoin has been stuck in a consolidation phase even as stocks have made a strong recovery. The Nasdaq 100 index has jumped by over 10% from its lowest level in March while the Dow Jones has risen by over 8.40%.
Therefore, there are concerns that this correlation is now decoupling although this will not become clear on Monday since American stocks will be closed for the memorial weekend.
Meanwhile, some investors believe that prices could continue stabilizing even as buyers remain more at bay. As such, the heavy selling experienced in the past few weeks could start slowing down. Also, there is a likelihood that Bitcoin will follow stocks if their bullish momentum continues.
At the same time, Bitcoin short-term implied volatility has slowed in the past few days while the put-to-call ratio has also slipped. Historically, a lower put-to-call ratio is usually a sign that positioning among bulls is more than that of bears.
Investors are also not as fearful as they were earlier this month. The CNN Money Fear and Greed index has moved from 11 to 21 while the Bitcoin fear and greed as moved from 10 to 14. Looking at the economic calendar, there is no major data that is expected today.
BTC/USD Forecast
The four-hour chart shows that the BTC/USD pair has been in a strong consolidation phase in the past few days. The pair has remained slightly below the important resistance at 30,000. At the same time, it has formed a symmetrical triangle pattern that is shown in blue. The pair is consolidating along the 25-day and 50-day moving averages while the Relative Strength Index (RSI) has move to the neutral point at 50.
Therefore, the pair will likely continue consolidating today. However, with the triangle pattern nearing its confluence level, there is a likelihood that a bullish breakout will happen. If this happens, the next key level to watch will be at 31,000.

