Previous BTC/USD Signal
My previous signal on 26th April was not triggered, as there was no bearish price action at any of the key support levels I had identified when they were reached that day.
Today’s BTC/USD Signals
Risk 0.50% per trade.
Trades must be taken before 5pm Tokyo time Tuesday.
Long Trade Ideas
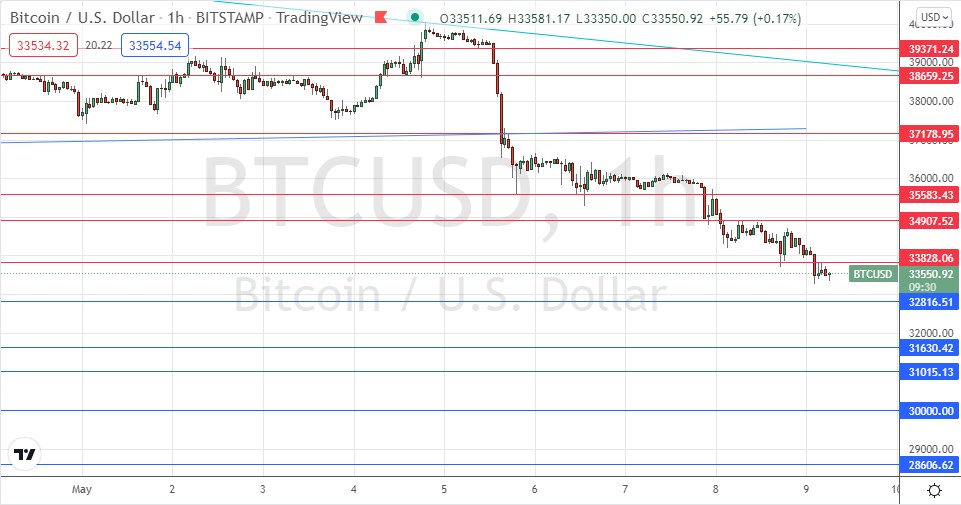
- Long entry after a bullish price action reversal on the H1 timeframe following the next touch of $32,817, $31,630, $31,015, $30,000, or $28,607.
- Place the stop loss $100 below the local swing low.
- Adjust the stop loss to break even once the trade is $100 in profit by price.
- Take off 50% of the position as profit when the trade is $100 in profit by price and leave the remainder of the position to run.
Short Trade Ideas
- Short entry after a bearish price action reversal on the H1 timeframe following the next touch of $33,828, $34,908, or $35,583.
- Place the stop loss $100 above the local swing high.
- Adjust the stop loss to break even once the trade is $100 in profit by price.
- Take off 50% of the position as profit when the trade is $100 in profit by price and leave the remainder of the position to run.
The best method to identify a classic “price action reversal” is for an hourly candle to close, such as a pin bar, a doji, an outside or even just an engulfing candle with a higher close. You can exploit these levels or zones by watching the price action that occurs at the given levels.
BTC/USD Analysis
I wrote in my last piece on 26th April that the best potential trade was a short trade from a bearish reversal at either of the nearby resistance levels, with $40,907 looking attractive, and $41,706 looking likely to be strong as it was confluent with the descending bearish trend line.
This was a good call as although the price never quite reached the nearest resistance level, I was right to see this as a pivotal area as the price fell without getting above it, after getting very close to it.
Bitcoin and cryptocurrencies in general have continued their declines for several weeks, and the bearish momentum had increased after the breakdown below the consolidating triangle pattern, which can be seen drawn with trend lines within the price chart below.
The price of Bitcoin has now entered what has historically been a very pivotal zone, from the support level at $28,607 to approximately $35k. The price has penetrated this zone and is showing no sign yet of a bullish reversal.
I see two scenarios approaching, either of which might be traded very profitably:
If the price can get established below the support level at $28,607 it could quickly fall to $10k or even lower, as the price moved very quickly between these price levels in its initial ascent.
If the price makes a bullish rebound, and Bitcoin continues to be bought every time it dips a little bit below the big round number at $30k, we could see a major bullish reversal, and an excellent risk reward ratio presented by a speculative long trade from this area of entry.
I think the best approach right now is to be prepared to go short from a reversal at any of the nearby resistance levels, but to trade small if the price remains above $28,607. Alternatively, a long trade might be a good opportunity if taken from a bounce off $30k or $28,607.
As a final note, the decline of cryptos should be taken as a lesson by newer traders that no matter how hot an asset looks and how far it rises, prices can go down as well as up. Bitcoin below $10k by the end of May is quite possible, though I am not forecasting that it is going to happen.
 There is nothing of high importance scheduled for today concerning the USD.
