Bearish View
- Sell the BTC/USD pair and set a sell-stop at 36,000.
- Add a stop-loss at 40,000.
- Timeline: 1-2 days.
Bullish View
- Set a buy-stop at 39,000 and a take-profit at 42,000.
- Add a stop-loss at 36,000.
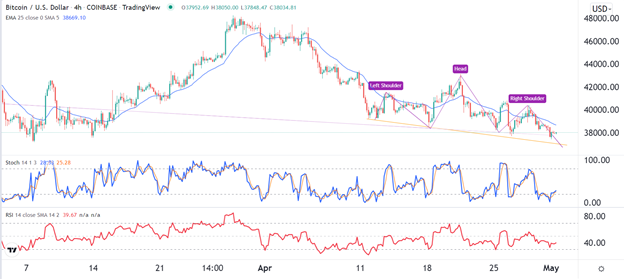
The BTC/USD pair remained in a tight range slightly below the important support of 40,000 even as gas prices jumped. It is trading at 38,000, which is about 21% below the highest level in April. In total, the market cap of all cryptocurrencies has dropped to about $1.8 trillion.
Risky Assets Tumble
Bitcoin and other risky assets had a difficult month in April as worries of a more hawkish Federal Reserve continued. For example, the Nasdaq 100 index, which is made up of the biggest technology companies, had its worst month since 2008 as trillions of dollars worth in value evaporated.
The S&P 500 index declined for the four straight weeks, with some of the best-known tech names like Amazon, Nvidia, Netflix, and Teladoc erasing billions of value. In the past few months, the correlation between Bitcoin and stocks has increased.
The main catalyst for the ongoing sell-off in both Bitcoin and stocks is the upcoming interest rate decision by the Federal Reserve. Analysts expect that the Fed will continue its hawkish tone that it started in March this year. This will involve hiking the interest rate by 0.50% and then starting quantitative tightening (QT) policies.
The BTC/USD has also declined as investors rush to the safety of the US dollar. While Bitcoin and stocks have fallen, the value of the US dollar has been in a strong bullish trend. The dollar index rose to $103 in April, the highest level since 2020.
Meanwhile, Bitcoin’s network difficulty continued soaring during the weekend. It rose to an all-time high of 29.79 trillion, according to data by Blockchain.com. Data also showed that the total hash rate continued climbing, reaching a high of 221.8 million TH/s.
BTC/USD Forecast
The BTC/USD pair has been under pressure in the past few months. It is trading at 38,000, which is slightly below the 25-day moving average. A closer look at the chart shows that the pair has formed a head and shoulders pattern. In price action analysis, this pattern is usually a bearish sign.
At the same time, the pair’s Relative Strength Index has moved close to the oversold level while the Stochastic oscillator has moved to the oversold level. Therefore, the pair will likely keep falling as bears target the key support at 35,000.

