Previous BTC/USD Signal
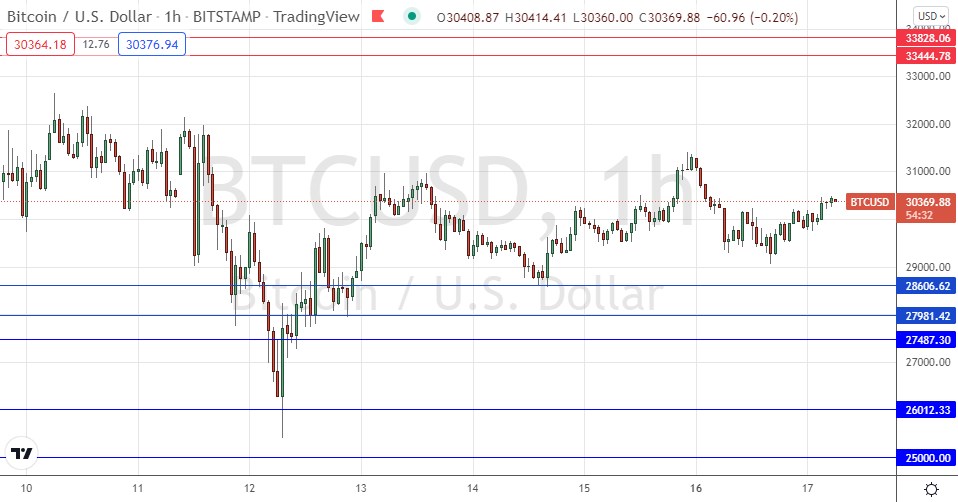
My previous signal on 9th May was not triggered, as there was no bullish price action at any of the key support levels I had identified when they were reached that day. Unfortunately, the price came close to $33,828 but never quite reached that level.
Today’s BTC/USD Signals
Risk 0.50% per trade.
Trades may only be entered prior to 5pm Tokyo time Wednesday.
Long Trade Ideas
- Go long after a bullish price action reversal on the H1 timeframe following the next touch of $28,607, $27,981, or $27,487.
- Put the stop loss $100 below the local swing low.
- Move the stop loss to break even once the trade is $100 in profit by price.
- Remove 50% of the position as profit when the trade is $100 in profit by price and leave the remainder of the position to ride.
Short Trade Ideas
- Go short after a bearish price action reversal on the H1 timeframe following the next touch of $33,445 or $33,828.
- Put the stop loss $100 above the local swing high.
- Move the stop loss to break even once the trade is $100 in profit by price.
- Remove 50% of the position as profit when the trade is $100 in profit by price and leave the remainder of the position to ride.
The best method to identify a classic “price action reversal” is for an hourly candle to close, such as a pin bar, a doji, an outside or even just an engulfing candle with a higher close. You can exploit these levels or zones by watching the price action that occurs at the given levels.
BTC/USD Analysis
I wrote in my last piece on 9th May that Bitcoin had fallen with strong bearish momentum after breaking down from a consolidating triangle chart pattern and entered what had historically been a very pivotal zone, from the support level at $28,607 to approximately $35k. I thought that if the price could get established below the support level at $28,607 it could quickly fall to $10k or even lower.
The price did get established below $28,607, but my call was not great as the price rebounded quite firmly and is now making a bullish consolidation above what is again the nearest key support level at $28,607.
I see Bitcoin’s recovery from the price area below $28,607 as technically significant, showing that buyers are still prepared to step in strongly when Bitcoin reaches long-term lows.
If the support level at $28,607 does not break down, I see the next likely price movement for Bitcoin as upwards to the next resistance level at $33,445.
I will be happy to take a long trade here if we get a retracement to $28,607 and a bullish bounce off that level.

Concerning the USD, there will be a release of Retail Sales data at 1:30pm London time.
