Bearish View
- Sell the EUR/USD and set a take-profit at 1.0480.
- Add a stop-loss at 1.0650.
- Timeline: 1 day.
Bullish View
- Set a buy-stop at 1.0600 and a take-profit at 1.0650.
- Add a stop-loss at 1.0500.
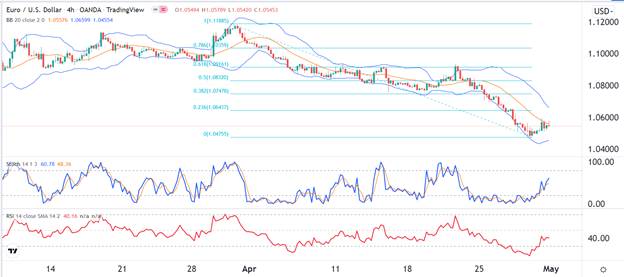
The EUR/USD pair is crawling back as investors rush to buy the dip following the spectacular decline in April. The pair is trading at 1.0545, which is slightly above last week’s low of 1.0472. That price was the lowest it had been since 2020 and was about 6% below the highest level in April.
Eurozone Concerns Remain
The EUR/USD has been under intense pressure in the past few weeks as investors remain concerned about the divergence between the Fed and the European Central Bank (ECB). The Fed is expected to sound more hawkish when it completes its meeting later this week. The overall expectation is that the bank will deliver a 0.50% rate hike and signal that it will deliver such hikes later this year.
Signs of a hawkish come at an interesting time for the American economy. Data published last week showed that pending home sales dropped for the fifth straight month. Further numbers revealed that the American economy had its first contraction since 2020 in the first quarter.
Therefore, there are concerns that the Fed’s tightening to fight inflation could have the unintended consequences of causing a recession. Besides, the yield curve made its first inversion in years a few weeks ago.
The key data to watch today will be German retail sales. Economists expect the data to show that sales rose by 0.3% in March on a month-on-month basis, leading to an annualized increase of 6.1%. The European Commission will also publish the latest business and consumer confidence numbers. Economists expect the data to show that the service sentiment rose to 14.2 while the industrial sentiment fell to 9.5.
The EUR/USD will also react to the latest Eurozone and US PMI data. Still, the biggest focus among investors will be focused on the upcoming Fed decision and the latest non-farm payrolls (NFP) data.
EUR/USD Forecast
The EUR/USD pair has been in a strong bearish trend in the past few days. It has attempted to crawl back in the past few days. The price is trading at the middle line of the Bollinger Bands and is slightly below the 23.6% Fibonacci retracement level.
At the same time, the Relative Strength Index (RSI) has moved slightly above the oversold level while the Stochastic Oscillator is approaching the overbought level. It has also formed what looks like a bearish flag pattern. Therefore, because of this pattern, there is a likelihood that it will soon have a bearish breakout to retest last week’s low of 1.0473.

