Bearish View
- Sell the GBP/USD pair and set a take-profit at 1.2550.
- Add a stop-loss at 1.2700.
- Timeline: 2 days.
Bullish View
- Set a buy-stop at 1.2650 and a take-profit at 1.2700.
- Add a stop-loss at 1.2600.
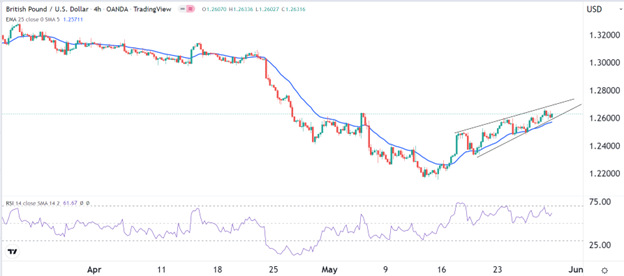
The GBP/USD pair maintained its bullish trend as the strong US dollar takes a breather. The pair rose to a high of 1.2631, which was about 3.80% above the lowest level this month. This price is close to its highest level on 26 April this year.
US Dollar Still Under Pressure
The US dollar has had a strong performance as its price jumped to the highest point in almost 20 years. Recently, however, the greenback rally has taken a breather as investors have moved to take profit.
The dollar has struggled after a series of mixed economic data from the United States. Data published recently showed that the housing sector in the US has continued to weaken. New and pending home sales declined sharply in April as prices continued rising.
At the same time, the Federal Reserve has insisted that it will continue tightening in the coming months. It expects to keep raising interest rates in the coming months. Minutes published last week showed that officials expect to hike by 0.50% in the coming three meetings and then shift to 0.25% hikes. Also, the bank is expected to start reducing its balance sheet.
The GBP/USD pair has also been rising as investors focus on the recent economic numbers from the UK. Data published this month revealed that home prices’ momentum was starting to slow. Other data showed that the unemployment rate and retail sales were doing well.
This week, there will be a few important data from the UK. On Tuesday, the Bank of England will publish the latest mortgage approval and lending data while the Nationwide Society will release the latest house price index data. The key catalyst for the pair will be the upcoming US non-farm payrolls data.
GBP/USD Forecast
The four-hour chart shows that the GBP/USD pair has been in a strong bullish trend in the past few days. This trend is being supported by the 25-day and 50-day moving averages. At the same time, the pair has formed what looks like a rising wedge pattern that is shown in black. Historically, this pattern is usually a bearish sign.
Therefore, the pair will likely have a bearish breakout this week. If this happens, the next key support level to watch will be at 1.2500.

