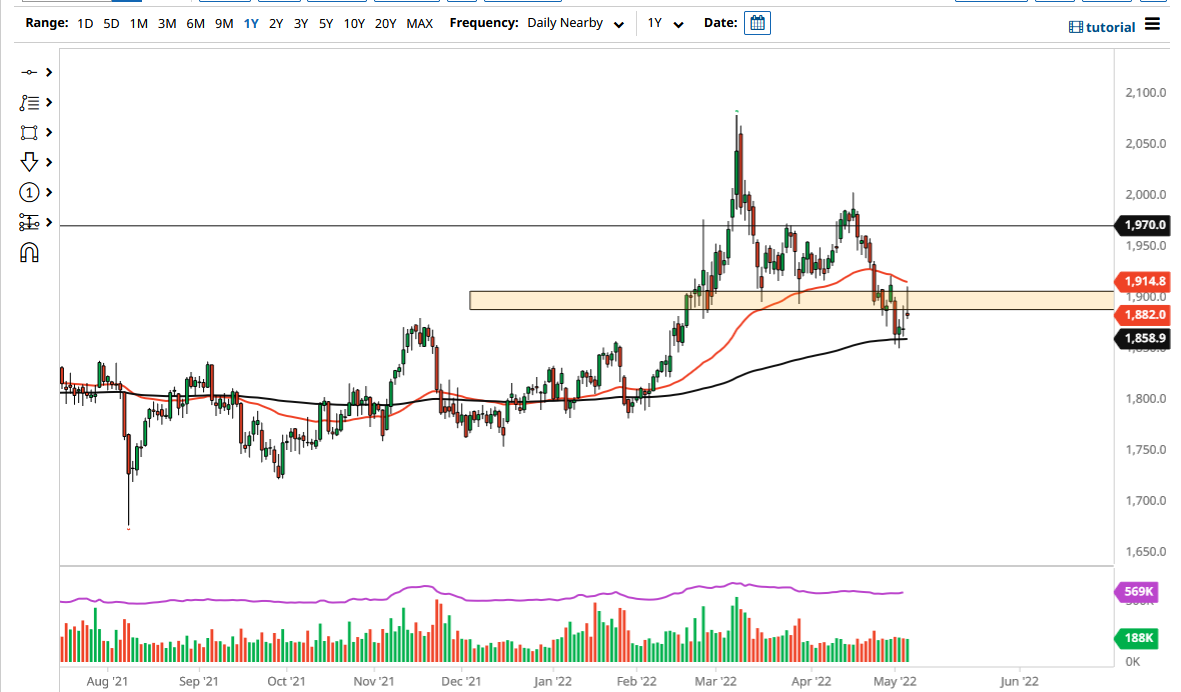
Gold markets shot higher during the trading session on Thursday as we gapped higher to kick off the day, to continue what had started late on Wednesday. The market reached as high as the 50 Day EMA but has since pulled back quite drastically. The ugly candlestick that we have formed for the day suggests to me that we are going to continue to struggle, as the 50 Day EMA is above the candlestick, and then the 200 Day EMA underneath offers support. Quite frankly, the market typically builds up a lot of inertia between these two moving averages, before making a bigger move.
If we were to break down below the 200 Day EMA, then it is likely that we will continue to see a massive selloff, perhaps sending gold down to the $1800 level. The $1800 level is an area where we had seen a move to the upside, so it could possibly be a target. Furthermore, it could also be a major support level, as it is historically so. If we were to break down below the $1800 level, then it is likely that we could go much lower.
On the other hand, if we were to turn around a break above the 50 Day EMA, then we could go looking to reach the $1970 level which has been resistant previously. Pay close attention to the US dollar, because the US dollar is king at the moment, and it is obvious that the gold market is being smacked around as a result. The shape of the candlestick does suggest that rallies will continue to be sold, but we have not completely broken through all of that support yet. The candlestick suggests that there are a lot of concerns out there and as a result, the US dollar continues to be the only thing that is working from a longer-term standpoint.
I do think that gold has started to kick off a big move lower, and therefore I have no interest in buying, at least not until we get a daily close above the 50 Day EMA. If we do get that, it would be a Herculean effort and therefore you would have to pay close attention to the market and what it was trying to tell you. The only thing you can count on is volatility at this point.


