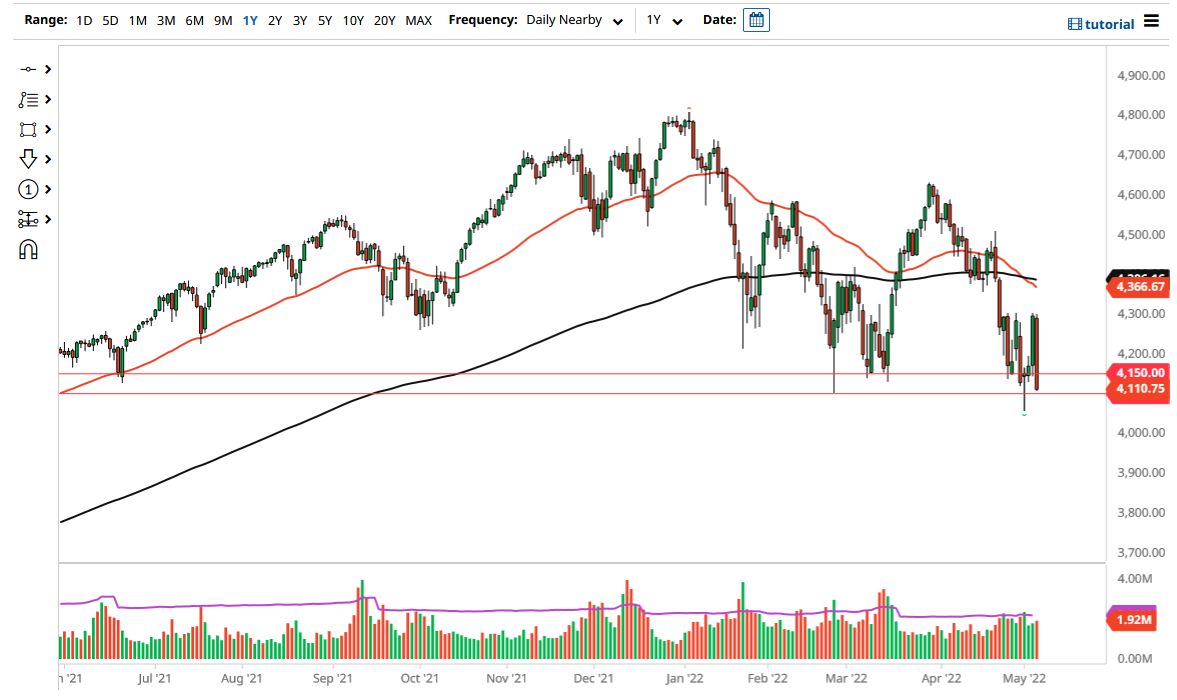
The S&P 500 has gotten crushed on Thursday to show significant signs of negativity. The market continues to see a serious attempt to break through major support, and now it looks as if the 4100 level is going to be challenged. If we break down the hammer from last week, look out below. At that point, the market will more likely than not start to challenge the crucial 4000 level. By breaking down below the 4000 level, the market is likely to go much lower.
The rally late in the day on Wednesday was a false one, perhaps a bit of short covering. After all, most of it was based upon the idea that the Federal Reserve has taken the idea of a 75 basis points rate hike off of the table. That being said, the market continues to see tighter financial conditions, and that is going to continue to work against the market. Ultimately, I think any time you see a rally you are looking at a significant selling opportunity, as the 4300 level has most certainly held as massive resistance.
Another thing that you need to pay close attention to is the fact that this massive candlestick is closing towards the bottom of the range, so that does suggest that we will continue to go lower. At the very best, the market is going to see a lot of back and forth in this 200 point range, but the fact that we have lost well over 4% in one day after having a shot higher during the previous session shows that the adults have entered the room, and they are not impressed by what happened after the press conference on Wednesday.
All of that being said, the market was to turn around a break above the 4300 level, it is likely that the market could go much higher, but that seems to be very unlikely to happen anytime soon. Ultimately, breaking above that could bring in a rush of short-covering, but I see that as being very unlikely at this point, and therefore I am looking to short-term charts for signs of exhaustion that we can start selling again. Ultimately, we have also just kicked off the so-called “death cross”, when the 50 Day EMA breaks down below the 200 Day EMA, which some traders will use for a longer-term signal.

