Bearish View
- Sell the AUD/USD pair and set a take-profit at 0.6800.
- Add a stop-loss at 0.7025.
- Timeline: 1-2 days.
Bullish View
- Set a buy-stop at 0.6980 and a take-profit at 0.7050.
- Add a stop-loss at 0.6900.
The AUD/USD price remained in a consolidation mode after the relatively mixed economic data from the United States. It is also range-bound as Australia’s government bond yields continued their upward trend. The pair is trading at 0.6922, where it has been in the past few days. This price is a few points above the lowest point this month.
Australia Bond Yields Rising
The AUD/USD pair is still consolidating as Australia’s government bonds sell-off continue. After falling early this month, yield of the 10-year government bonds rose to 3.75%, which was the highest level since Thursday last week.
The performance of Australia’s bonds is a sign that investors expect the Reserve Bank of Australia (RBA) to continue hiking interest rates in next week’s meeting. Analysts expect that the RBA will hike rates by another 0.50% rate hike, bringing the YTD increase to 125 basis points.
Like other central banks, the RBA is having a difficult balancing act as it fights against the rising inflation. The challenge is that hiking rates could lead to a significant recession in the coming months as it curtails spending.
The AUD/USD price is also in a tight range even as China made progress towards reopening. The country announced that it will reduce the number of quarantine days from 14 to 7 as the number of Covid infections fall. China is still an outlier since most countries have reopened to vaccinated individuals.
Meanwhile, data from the United States paint a different picture about the American economy. According to Conference Board, consumer confidence dropped from 106 in May to a 9-year low of 98 in June. Consumers are seeing the cost of doing business rise and the value of their 401(k) disappear as the stock market crashes.
AUD/USD Forecast
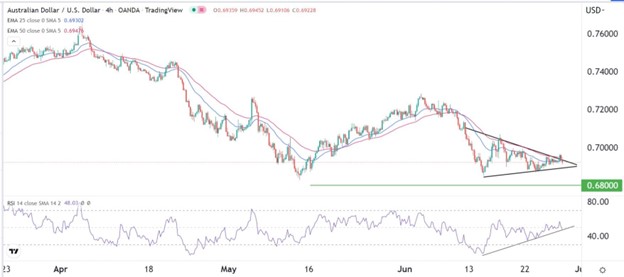
The AUD/USD pair has been in a strong bearish trend as investors assess the current state of the American and Australian economies. The pair is trading at 0.6923, where it has been in the past few days.
On the 4H chart, the pair has formed a symmetric triangle pattern that is shown in black. It is also consolidating along the 25-day and 50-day moving averages while the Relative Strength Index (RSI) has formed a bullish divergence pattern.
Therefore, the pair will likely have a bearish breakout since this pattern resembles a pennant pattern. If this happens, the next key support level to watch will be at 0.6800.

