Bearish View
- Sell the AUD/USD pair and set a take-profit at 0.6850.
- Add a stop-loss at 0.700.
- Timeline: 1-2 days.
Bullish View
- Set a buy-stop at 0.6954 and a take-profit at 0.7050.
- Add a stop-loss at 0.6890.
The AUD/USD moved sideways as investors reflected on the latest statement by Jerome Powell and US housing data. The pair also consolidated as Australia’s and American bond yields rose sharply. It is trading at 0.6923, where it has been in the past few days.
US and Australia Bond Sell-Off
The AUD/USD pair has been in a consolidation phase as investors focus on the ongoing bond sell-off. In Australia, yields of the 10-year government bonds rose to 3.84%. Smilarly, in the US, the ten-year yield rose to 3.21% while the 30-year rose to 3.32%.
The soaring bond yields are a reflection of the fact that the Reserve Bank of Australia (RBA) and the Federal Reserve have embraced a more hawkish tone recently. Earlier this month, the RBA decided to hike interest rates by 0.50% in its battle against inflation.
Similarly, the Federal Reserve decided to hike interest rates by 0.75%, the biggest increase in almost three decades. In testimonies to Congress last week, the Fed chair said that these rate hikes were necessary in its fight against inflation.
There will be no economic data from Australia on Tuesday. Therefore, investors will focus on the upcoming American consumer confidence data by the Conference Board. The data comes at a time when Americans are paying $5 per gallon of gasoline while mortgage rates have jumped to over 6%.
Therefore, analysts expect that the country’s consumer confidence dropped from 106 to 100 in June. This is an important data since consumers are the most important part of the American economy. As such, if consumer spending declines, there are higher odds of a recession.
Data published on Monday by JP Morgan showed that confidence among America’s small businesses dropped to a multi-year low. These companies are worried about the rising cost of doing business.
AUD/USD Forecast
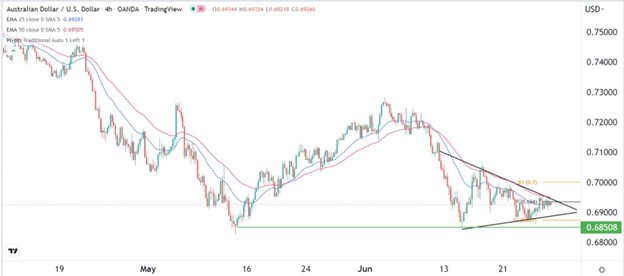
The four-hour chart shows that the AUD/USD pair has moved sideways in the past few days. It is trading between the 25-period and 50-period moving averages. Also, the pair has formed a symmetrical triangle pattern that is shown in black. It is also slightly above the key support level at 0.6850, which was the lowest level on June 14th and May 12th. The pair is also along the standard pivot point.
Therefore, the pair will likely have a bearish breakout in the coming days. If this happens, the next level to watch will be at 0.6850.

