Bullish View
- Buy the BTC/USD pair and set a take-profit at 24,400.
- Add a stop-loss at 21,000.
- Timeline: 1-2 days.
Bearish View
- Set a sell-stop at 22,000 and a take-profit at 21,000.
- Add a stop-loss at 23,500.
The BTC/USD price pulled back slightly from its highest point last week as investors reflected on news that Tesla had sold some of its coins in the second quarter. The pair is trading at 22,700, which is about 6.40% below the highest point this month.
Elon Musk Sells Bitcoin
The biggest story last week was that Tesla sold some of its Bitcoins even as the price continued falling. Musk reiterated that he was still bullish on Bitcoin and that the company sold tje holdings because of the rising inflation.
Bitcoin also pulled back as American stocks retreated slightly as investors reacted to the ongoing earnings season. According to FactSet, 21% of all companies in the S&P 500 have reported their earnings. 68% of these companies reported a positive EPS surprise while 65% reported a revenue surprise. The average earnings growth was 4.8%, which was the lowest level since 2020.
The next key catalyst for Bitcoin will be the upcoming interest rate decision by the Federal Reserve. Economists expect that the bank will hike interest rates by 75 basis points or 100 basis points. It has already hiked by 150 basis points this year as inflation continue rising. Data published last week revealed that US inflation surged to a multi-decade high of 9.4%.
The BTC/USD price will also react to the performance of Ethereum prices. Ether has jumped sharply in the past few weeks as investors focus on the upcoming merge of the current version and the Beacon chain. This merge will transition Ethereum from a proof-of-work to a proof-of-stake network.
Bitcoin has also recovered recently as investors assume that the worst has happened already considering that the market has done well even after the collapse of companies like Three Arrows Capital, Voyager Digital, and Celsius.
BTC/USD Forecast
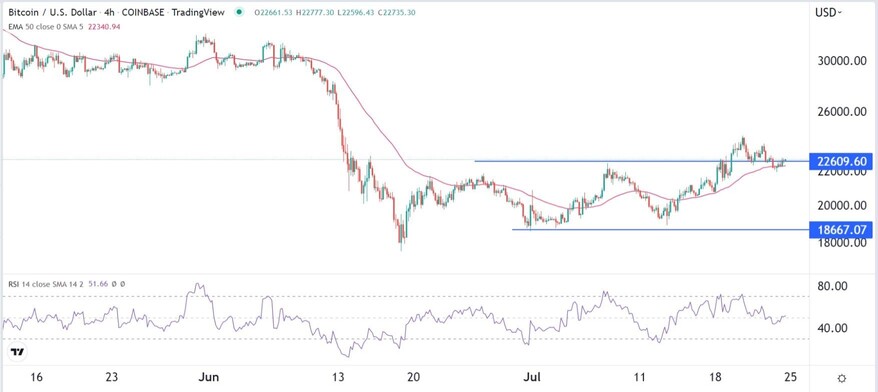
The BTC/USD price rose to a monthly high of 24,261 last week. As it rose, it moved above the important resistance level at 22,601, which was the highest point on 8th June.
Now, the pair has retested 22,601, in what looks like a break and retest pattern. In price action analysis, this pattern is usually a bullish continuation.
The price has moved slightly above the 50-day moving average while the Relative Strength Index (RSI) has moved from the overbought level of 70 to the current level of 50.
Therefore, the pair will likely resume the bullish trend as bulls retarget the important resistance level at 24,400, which was the highest point last week.

Ready to trade our free daily Forex trading signals? We’ve shortlisted the best Forex trading brokers in the industry for you.
