Bullish View
- Buy the GBP/USD and set a take-profit at 1.2200.
- Add a stop-loss at 1.1950.
- Timeline: 1-2 days.
Bearish View
- Set a sell-stop at 1.200 and a take-profit at 1.1950.
- Add a stop-loss at 1.2050.
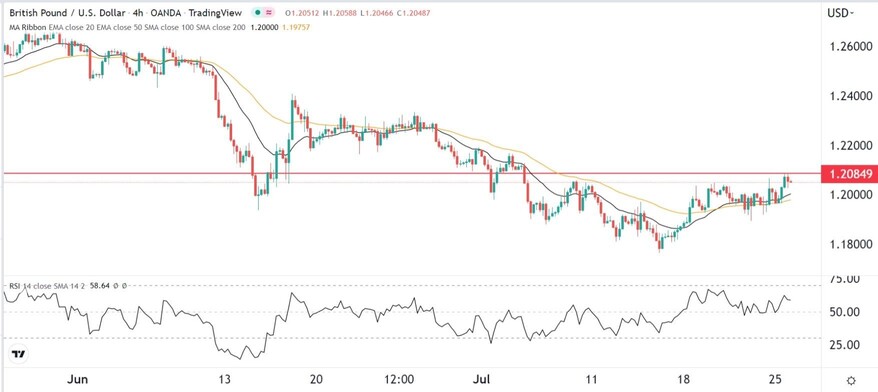
The GBP/USD price rose to the highest point since July 5th this year as the dollar weakness continued. The pair rose to a high of 1.2085, which was about 2.82% above the lowest level this month.
US Consumer Confidence and Housing Data
The GBP/USD pair made a comeback last week as the US dollar retreated and after the UK published important economic numbers. On Tuesday, the country published strong jobs numbers followed by worrying inflation data on Wednesday. The country's inflation soared to a multi-decade high of 9.1% in June. Finally, the UK released weak retail sales data on Friday.
With the important UK data now published, the main catalyst for the GBP/USD pair will be numbers from the US and the upcoming interest rate decision by the Federal Reserve.
The Conference Board will release the closely watched consumer confidence data later today. Analysts expect the data to reveal that the soaring cost of living helped to drive the country's consumer confidence to the lowest level since February 2021. Consumer confidence is an important data because consumer spending is the biggest part of the country's economy.
The GBP/USD will also react to the latest housing numbers from the US. Economists expect that the country’s house price index remained at an elevated level in June even as mortgage rates rise in the country.
These numbers will come as the Federal Open Market Committee (FOMC) starts its July meeting. The committee will deliberate on the recent economic numbers from the US such as the soaring inflation and falling unemployment rate. It will also focus on the weakening retail and housing sector.
Analysts expect that the bank will continue hiking interest rates in this month's meeting. The main expectation is that the central bank will hike interest rates by 0.75% although some expect a 1% hike.
GBP/USD Forecast
The four-hour chart shows that the GBP/USD pair has been in an upward trend in the past few days. It has formed an inverted head and shoulders pattern whose neckline is at 1.2085. In price action analysis, this is usually a bullish pattern.
On the four-hour chart, the pair moved above the 25-day and 15-day moving averages. The Relative Strength Index (RSI) is moving sideways and is slightly below the overbought level of 70. The pair will likely have a bullish break-out as buyers target the next key resistance level at 1.2200.

Ready to trade our free trading signals? We’ve made a list of the best brokers to trade Forex worth using.
