Previous BTC/USD Signal
My previous signal on 18th August was not triggered as there was no bullish price action when the support levels which I had identified were first reached that day. Unfortunately, the high of the day was just below the nearest resistance level.
Today’s BTC/USD Signals
Risk 0.50% per trade.
Trades must be taken prior to 5pm Tokyo time Friday.
Long Trade Ideas
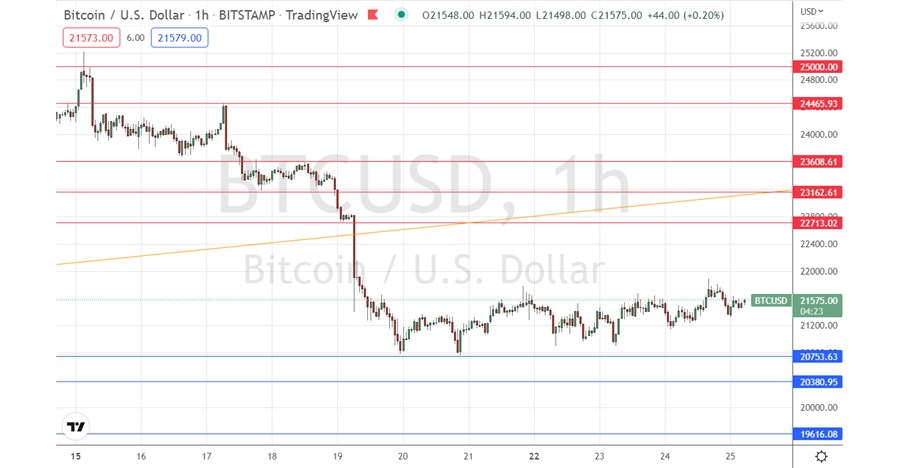
- Long entry after a bullish price action reversal on the H1 timeframe following the next touch of $20,754 or $20,381.
- Put the stop loss $100 below the local swing low.
- Move the stop loss to break even once the trade is $100 in profit by price.
- Remove 50% of the position as profit when the trade is $100 in profit by price and leave the remainder of the position to ride.
Short Trade Ideas
- Short entry after a bearish price action reversal on the H1 timeframe following the next touch of $22,713, $23,163, or $23,609.
- Put the stop loss $100 above the local swing high.
- Move the stop loss to break even once the trade is $100 in profit by price.
- Remove 50% of the position as profit when the trade is $100 in profit by price and leave the remainder of the position to ride.
The best method to identify a classic “price action reversal” is for an hourly candle to close, such as a pin bar, a doji, an outside or even just an engulfing candle with a higher close. You can exploit these levels or zones by watching the price action that occurs at the given levels.
BTC/USD Analysis
I wrote in my previous analysis on 18th August that the price of BTC/USD was prone to a bearish reversal, with the resistance level at $23,609 looking attractive for a short trade as it had become likely “role reversal” resistance so would probably be likely to hold if reached. I was also interested in a long trade from the support level at $22,713.
Neither of these opportunities set up, with the high of the day unfortunately just a little below $23,609.
As it happened, during the later Asian session, the price broke down from its medium-term bullish price channel, finding a bottom just above the support level at $20,754.
The price has been consolidating since then above this supportive area, making a weakly bullish pattern of higher lows.
The price has room to rise and seems unwilling to fall further, with no key resistance levels overhead until $22,713.
Traders today might look to buy a bullish breakout above $21,900 / $22k, or alternatively hope for a retracement to the support level at $20,754 and go long following a bullish rejection there.
With today’s Jackson Hole symposium, it feels like we may see a major reversal in the US Dollar and a boost for riskier assets, which suggests upward price movement for Bitcoin.
Concerning the US Dollar, there will be a release of Preliminary GDP at 1:30pm London time, followed later by the start of the Jackson Hole symposium and Fed Chair Powell’s speech.
Ready to trade our free daily Forex trading signals? We’ve shortlisted the best MT4 crypto brokers in the industry for you.

