Bearish view
- Sell the BTC/USD pair and set a take-profit at 20,000.
- Add a stop-loss at 23,000.
- Timeline: 1-2 days.
Bullish view
- Set a buy-stop at 22,000 and a take-profit at 23,000.
- Add a stop-loss at 21,000.
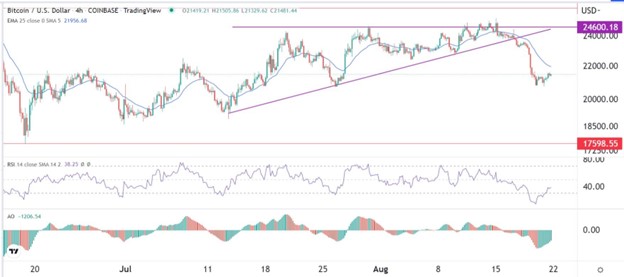
The BTC/USD price pulled back slightly after last week’s strong sell-off. The pair dropped from this month’s high of 25,168 to a low of 20,699 as the bullish momentum faded. It was trading at 21,460, giving Bitcoin a market cap of over $410 billion.
Strong US dollar and Tornado Cash crackdown
The BTC/USD pair continued its sell-off as the US dollar resumed its bullish trend. The US dollar index rose to $107 after the relatively hawkish minutes by the Federal Reserve. These minutes revealed that the bank will continue hiking interest rates in the coming months to fight the elevated inflation.
As a result, US bond yields rose while stock indices like the Dow Jones and Nasdaq 100 indices declined sharply and snapped a four-week winning streak. Bitcoin has a close correlation with American stocks. Other cryptocurrencies also declined, bringing the total market cap of cryptocurrencies to about $1 trillion.
The BTC/USD price also declined because of the rising risk of more regulations. This month, the Treasury Department decided to sanction Tornado Cash, a cryptocurrency mixer. The department accused it of helping launder over $7 billion worth of cryptocurrency since 2019.
Tornado Cash is a cryptocurrency mixer on the Ethereum blockchain. It works by obfuscating the origin, destination, and counterparties of transactions. It does this by receiving transactions and then mixes them before sending them to recipients. As a result, there are concerns that the regulators will get more tough on cryptocurrencies.
The BTC/USD price also pulled back as investors started taking profit considering that it managed to move from the year-to-date low of about 18,000 to 25,000. Historically, Bitcoin tends to experience a pullback after an extended period of rallying. The next key catalyst for the pair will be the upcoming Jackson Hole Symposium.
BTC/USD forecast
The BTC/USD pair has been in a strong rebound since June this year. However, the pair struggled to move solidly above the important resistance at 25,000. Last week, it invalidated the ascending triangle pattern by moving below the diagonal line.
It also moved below the 25-day and 50-day moving averages. Now, the Relative Strength Index (RSI) has moved slightly above the oversold level. The awesome oscillator has also tilted upwards. Therefore, the pair will likely stabilize on Monday and then resume the downward trend to 20,000.
Ready to trade our daily Forex signals? Here’s a list of some of the best crypto brokers to check out.

