Bearish view
- Sell the GBP/USD pair and set a take-profit at 1.1750.
- Add a stop-loss at 1.1900.
- Timeline: 1-2 days.
Bullish view
- Set a buy-stop at 1.1900 and a take-profit at 1.2000.
- Add a stop-loss at 1.1800.
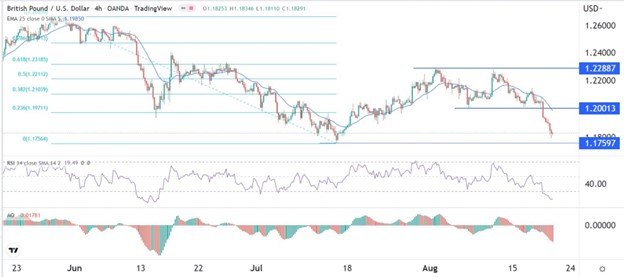
The GBP/USD price crashed to the lowest level since July as the US dollar rose across the board. It dropped to a low of 1.1830, which is much lower than this month’s high of 1.2288.
US dollar strength
The GBP/USD pair continued its downward trend as the US dollar staged a major rally. The greenback rose against most currencies, including the Swiss franc, euro, and Japanese yen. As a result, the dollar index, which tracks its performance against a basket of currencies, rose to the highest point in weeks.
The US dollar strength continued after Chinese data showed that the economy was weakening. Industrial production and retail sales growth was lower than estimated, pushing the PBoC to lower rates on key bonds.
The strength then accelerated after the Federal Reserve published minutes of its past monetary policy meeting. The minutes showed that the bank’s officials were increasingly concerned that inflation will become entrenched in the economy for a long time.
At the same time, the officials were worried about moving too fast and too soon on rate hikes. It has already hiked interest rates by 225 basis points this year and started implementing a quantitative tightening policy.
Federal Reserve speakers like Charles Evans, Lorretta Mester, and Neel Kashkari said that the bank will likely continue hiking in the coming meetings. Expectations are that the bank will hike by 0.50% in its September meeting.
There will be no economic data from the UK and the US on Monday. Therefore, the market will continue focusing on last week’s actions of the Federal Reserve.
The next key economic numbers will come on Tuesday when S&P publishes the flash manufacturing and services PMI numbers. Analysts expect that the PMIs made some modest improvements in August as the price of oil dropped slightly.
GBP/USD forecast
Turning to the four-hour chart, we see that the GBP/USD pair formed a double-top pattern at 1.2288 this month. It then managed to move below the neckline of this pattern at 1.2000 on August 5. The pair dropped below the 25-day and 50-day moving averages.
The Relative Strength Index (RSI) has moved to the oversold level while the Oscillator has moved below the neutral level. Therefore, the pair will likely continue falling as sellers target the next key support at 1.1750. This price is slightly below the year-to-date low of 1.1760.
Ready to trade our free daily Forex trading signals? We’ve shortlisted the best Forex trading brokers in the industry for you.

