Bearish view
- Sell the GBP/USD pair and set a take-profit at 1.1500.
- Add a stop-loss at 1.1750.
- Timeline: 1-2 days.
Bullish view
- Set a buy-stop at 1.1700 and a take-profit at 1.1765.
- Add a stop-loss at 1.1600.
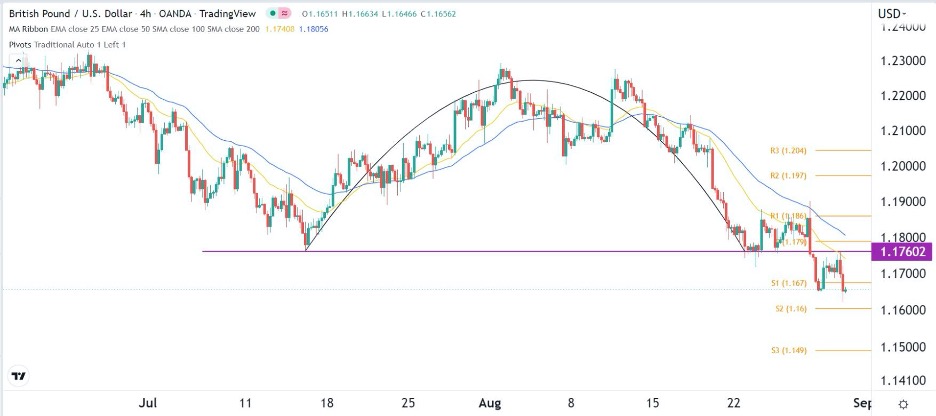
The GBP/USD exchange rate crashed to the lowest point in more than two years after the strong economic data from the United States. It slipped to a low of 1.1625, which was much lower than this month’s high of 1.2295.
Strong US consumer confidence data
The GBP/USD pair dropped sharply as the US dollar rally gathered momentum. The dollar rose sharply after the US published strong economic numbers that reinforced Federal Reserve’s hawkish stance.
In a report, the Conference Board said that the country’s consumer confidence rose sharply in August as the cost of gasoline fell. Confidence jumped from 95.3 in July to 103.2 in August, which was higher than the median estimate of 97.9.
According to AAA, the average gasoline price in the US has jumped from a year-to-date high of $5.30 to the current $3.50. As a result, there are signs that the prices of travel and other items will start falling in the coming months.
Additional data showed that the country’s labor market is still vibrant. According to the Bureau of Labor Statistics (BLS), the number of job vacancies in the US rose from 11.04 million in June to over 11.2 million in July.
ADP will publish its estimate of private payrolls later on Wednesday while the BLS will release the latest non-farm payrolls (NFP) data on Friday. Analysts believe that the country’s unemployment rate dropped to 3.4% in July.
The GBP/USD pair also slipped as gas prices in Europe continued rising. Russia will halt the Nordstream 1 pipeline for three days for maintenance, which will halt gas supplies to Europe. While the UK is less dependent on Russian gas, the fallout has led to elevated gas prices. On Monday, Ofgem announced that it will hike prices by 80% in October.
GBP/USD forecast
The four-hour chart shows that the GBP/USD pair has been in a strong bearish trend in the past few days. As it dropped, the pair formed an inverted cup and handle pattern. It dropped below the lower side of the cup on August 22 and then made a break and retest pattern. In price action analysis, a break and retest pattern is usually a sign of continuation.
The pair dropped below the 25-day and 50-day moving averages and the first support of the standard pivot point. Therefore, the pair wil likely continue falling as sellers target the second support level at 1.1500.
 Ready to trade our daily Forex signals? Here’s a list of some of the best Forex trading platforms to check out.
