Bearish view
- Sell the BTC/USD and set a take-profit at 18,000.
- Add a stop-loss at 20,500.
- Timeline: 1-2 days.
Bullish view
- Set a buy-stop at 20,500 and a take-profit at 22,000.
- Add a stop-loss at 18,000.
The BTC/USD remained in a tight range on Monday as cryptocurrencies recoiled. Bitcoin was trading at about $19,600, where it has been in the past few weeks. The price is substantially below its all-time high of nearly 70,000.
US dollar strength
Bitcoin and other cryptocurrencies came under intense pressure as the dollar strength continued. The dollar index, which tracks the performance of the greenback against other cryptocurrencies, soared to the highest level in over 20 years.
The strength of the US dollar is mostly because of the extremely hawkish Federal Reserve and the overall move from risk assets. Indeed, American stocks have pulled back sharply in the past few sessions while Treasury yields have continued rising. The yield of the 10-year government bond rose to 3.45% while the 30-year rose to 3.52%.
The BTC/USD price remained under pressure after Ethereum concluded its merge event. This merge helped to transition the second biggest cryptocurrency in the world from a proof of work (PoW) network to a proof of stake platform that is substantially more climate-friendly. Therefore, cryptocurrencies wavered after the merge as investors sold the fact.
The BTC/USD pair has also struggled as investors focus on Federal Reserve's policies. The Fed has decided to embrace an extremely hawkish policy as it continues battling soaring inflation. Data published this month showed that the US inflation rose slightly in August and remained at the highest level in four decades.
Therefore, analysts believe that the Fed will sound extremely hawkish when it meets this week. Some analysts expect that it will deliver a jumbo hike of 100 basis points. Others expect that it will hike by 0.75% for the third straight meeting. It will also set the stage for more hikes in the final two meetings of the year.
BTC/USD forecast
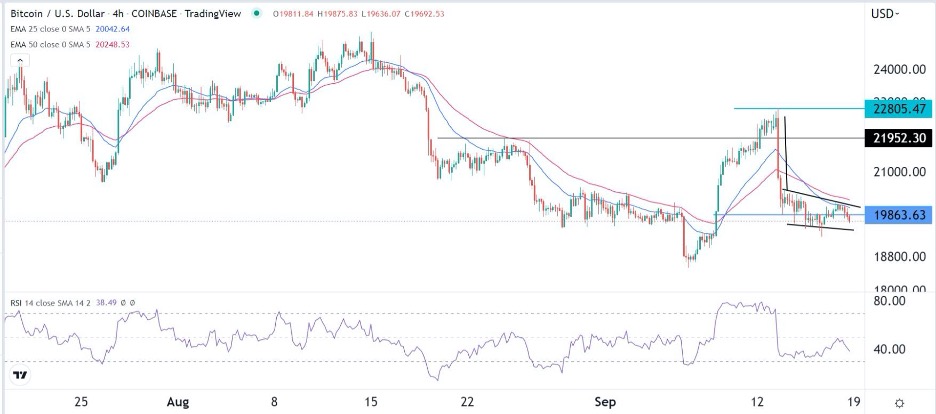
The BTC/USD pair has been under pressure in the past few days. It crashed from last week’s high of 22,805 to a low of 19,315. It has moved slightly below the 25-day and 50-day moving averages. The pair has also formed a bearish flag pattern that is shown in black. At the same time, the RSI has moved close to the oversold level.
Therefore, the pair will likely have a bearish breakout as sellers target the next key support level at 18,500. A move above the resistance at 20,500 will invalidate the bearish view.
 Ready to trade our free Bitcoin trading signals? We’ve made a list of the best Forex crypto brokers worth trading with.
