Previous BTC/USD Signal
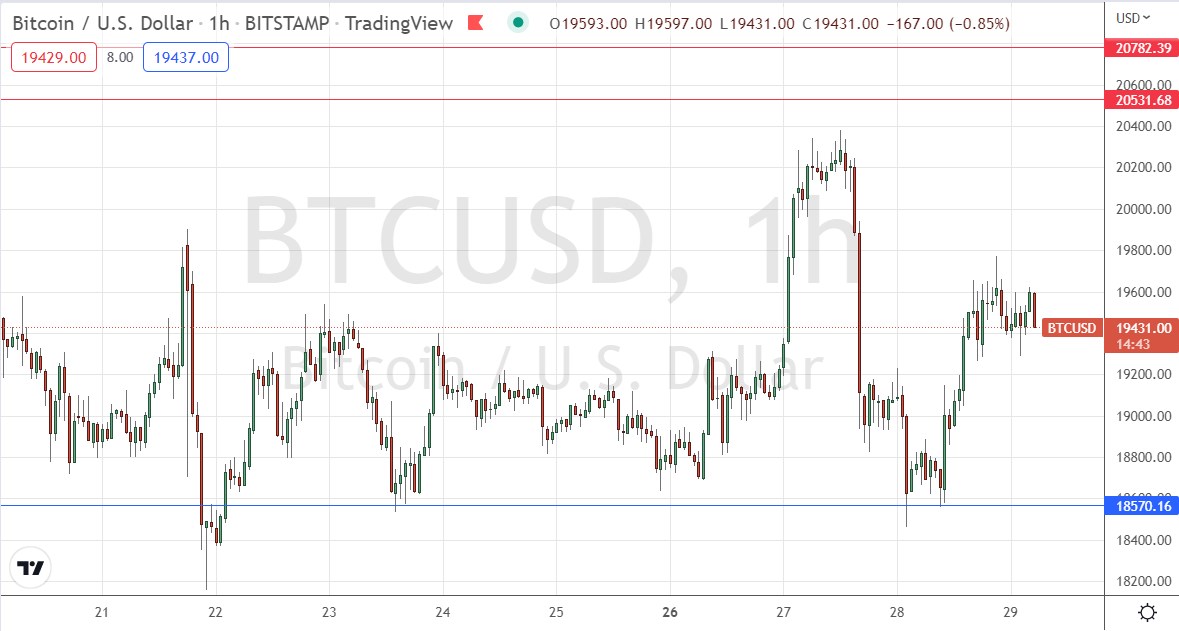
My Bitcoin signal yesterday produced a profitable long trade from the bullish rejection of the support level I had identified at $18,570.
Today’s BTC/USD Signals
Risk 0.50% per trade.
Trades may only be entered before 5pm Tokyo time Friday.
Long Trade Idea
- Go long after a bullish price action reversal on the H1 timeframe following the next touch of $18,570.
- Place the stop loss $100 below the local swing low.
- Adjust the stop loss to break even once the trade is $100 in profit by price.
- Take off 50% of the position as profit when the trade is $100 in profit by price and leave the remainder of the position to run.
Short Trade Ideas
- Go short after a bearish price action reversal on the H1 timeframe following the next touch of $20,532 or $20,782.
- Place the stop loss $100 above the local swing high.
- Adjust the stop loss to break even once the trade is $100 in profit by price.
- Take off 50% of the position as profit when the trade is $100 in profit by price and leave the remainder of the position to run.
The best method to identify a classic “price action reversal” is for an hourly candle to close, such as a pin bar, a doji, an outside or even just an engulfing candle with a higher close. You can exploit these levels or zones by watching the price action that occurs at the given levels.
BTC/USD Analysis
I wrote in my previous analysis yesterday that the price of BTC/USD looked likely to have a pivotal point at $18,570 which might produce a bullish bounce for a speculative long-term long trade, although I also saw the potential of a spectacular breakdown below that level.
It was my first scenario which came to pass, and this was a great call as the level clearly did act as strong support and could have been used to enter a healthy long trade.
Bitcoin and crypto in general are not the most exciting assets in the market these days, ironically there has been much more action in old-fashioned fiat currencies over the past few weeks. If we look at the price chart, we see that the price has been ranging in this area for some time. If this pattern continues to be repeated, we can expect that the price might rise to the resistance levels between $20,532 and $20,782 before turning bearish again.
I think there may be a bigger development than this predictable scenario, but that will probably depend on whether we have seen the Dollar bottom out and the start of a real recovery by risky assets. If so, this will likely lift Bitcoin higher, all starting from the buying we saw yesterday at the pivotal point of $18,570. However, the price is still closer to support than resistance, so I would look for another chance to go long from a bounce at $18,570 or wait for the price to get established below that level and then make a failed test of it as resistance from below before going short.

There is nothing of high importance scheduled today regarding the US Dollar.
Ready to trade our daily Bitcoin crypto signals? Here’s a list of some of the best cryptocurrency brokers to check out.
