Bearish view
- Sell the BTC/USD pair and set a take-profit at 18,500.
- Add a stop-loss at 20,800.
- Timeline: 1-2 days.
Bullish view
- Set a buy-stop at 20,500 and a take-profit at 21,500.
- Add a stop-loss at 19,000.
The BTC/USD continued consolidating on Wednesday morning as investors waited for the next catalyst and as the US dollar rose. The pair was trading at 20,100 on Wednesday, which was slightly above the August low of 19,530.
US dollar strength
The BTC/USD price wavered as investors continued focusing on the extremely hawkish statement by Federal Reserve officials. In an interview on Wednesday, Cleveland Fed’s Loretta Mester warned that the bank will continue hiking interest rates in the coming months.
Specifically, she said that she believes that the bank will hike the benchmark rate rising above 4% by early next year. She also believes that rates will remain at a high level in 2023 as she repeated Powell’s statement that they will remain high for some time. She added:
“It would be a mistake to declare victory over the inflation beast too soon. Doing so would put us back in the stop-and-go monetary policy world of the 1970s, which was very costly to households and businesses.”
Her sentiment has been shared by most Fed officials, including Jerome Powell. They argue that higher interest rates are necessary since inflation is at an elevated level while the labor market is still tight.
Historically, BTC and other risky assets like stocks tend to underperform in a period of high-interest rates. Indeed, American shares have dropped in the past few consecutive days following Powell’s speech at the Jackson Hole Summit.
The BTC/USD price is also wavering as the US dollar index continues to rise. The dollar index surged to the highest level in over 20 years as investors wait for the upcoming US non-farm payrolls (NFP) data scheduled for Friday this week.
Meanwhile, the fear and greed index shows that investors are getting fearful. It dropped from last week’s greed zone of 57 to the fear level.
BTC/USD forecast
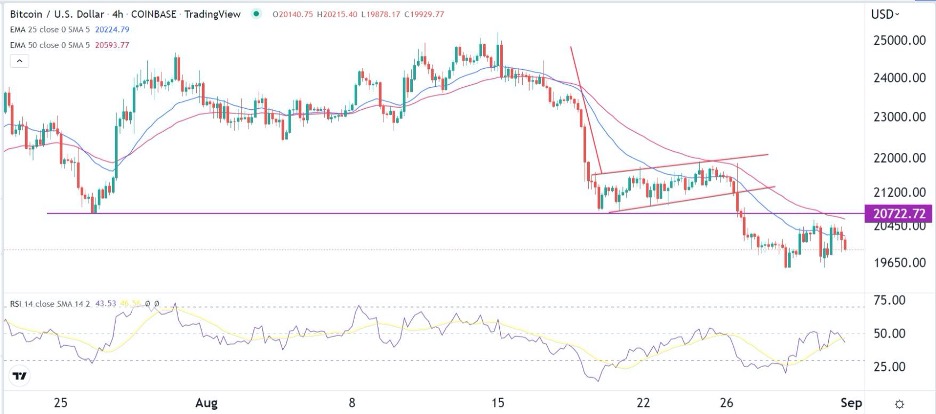
The four-hour chart shows that the BTC/USD pair has been in a strong bearish trend in the past few weeks. The pair managed to move below the important support at 20,772, which was the lowest level on August 21st. It has also formed a break and retest pattern.
The pair moved below the 25-day and 50-day moving averages while the Relative Strength Index (RSI) has moved slightly below the neutral point at 50. Therefore, the pair will likely continue falling as sellers target the next key support at 18,500.
 Ready to trade our daily Bitcoin signals? Here’s a list of some of the best crypto brokers to check out.
