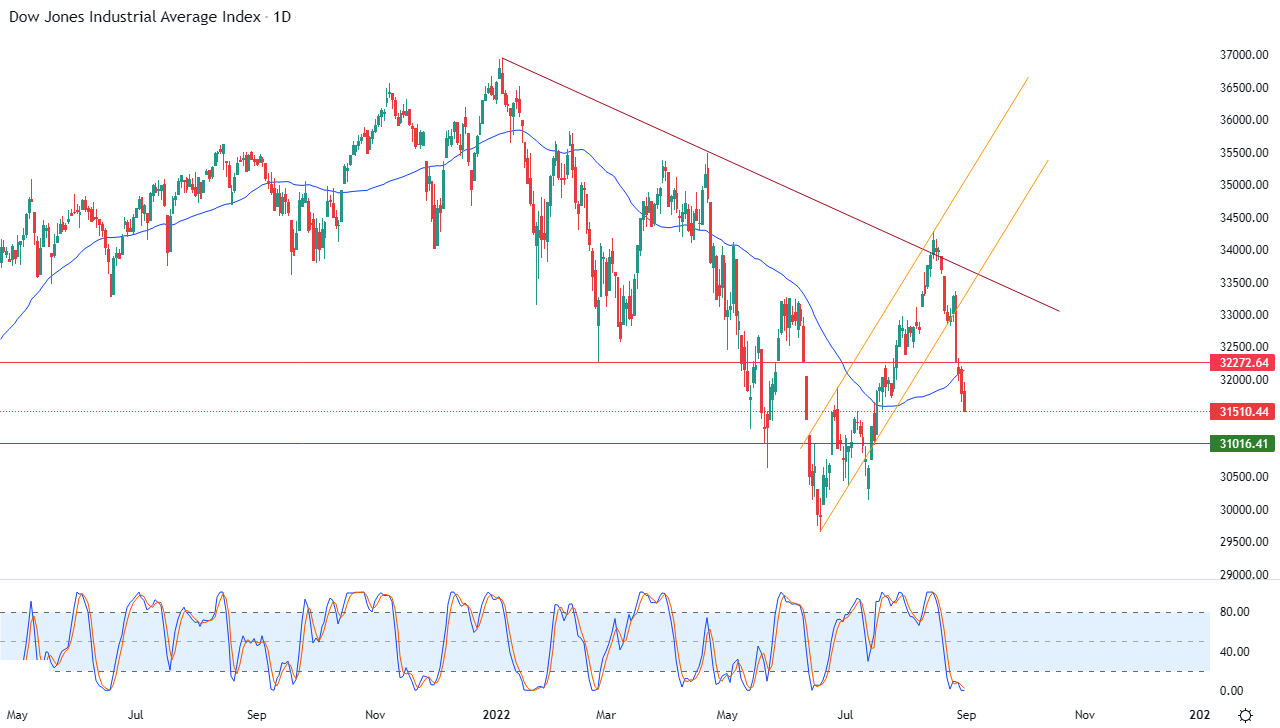
- The Dow Jones Industrial Average declined in its recent trading at the intraday levels, registering record losses for the fourth consecutive day.
- The Index fell by -0.88%, losing about 280.44 points, and settled at the end of trading at the level of 31,510.44.
- Previously it had declined during Tuesday's trading by -0.96%. During the month of August, the index declined by -4.06% to lose about 1,334.70 points.
US stocks ended the month with their fourth consecutive daily decline. They consolidated the weakest August performance in seven years, as concerns persisted about large interest rate increases by the Federal Reserve.
The index suffered its biggest monthly percentage decline in August since 2015, as selling pressure accelerated after hopes dashed for a modest increase in interest rates. The Federal Reserve Chairman Jerome Powell's gave Hawkish remarks last Friday, affirming that the bank is keeping monetary policy tight "for some time",
Cleveland Fed President Loretta Meister said Wednesday that the central bank will need to raise interest rates somewhat above 4% by early next year. They also plan to hold them at that level to bring inflation back to the Fed's target.
In addition to investor nervousness, stocks are also heading for a historically weak period for the market in September, September is usually the worst month of the year, it and February are the only ones to record declines on average, but September is the only month of the year It falls more than it rises.
Data earlier in the day showed ADP private payrolls increased by 132K jobs in August, which is less than economists' expectations for job growth of 288K. However, the report for June and July was suspended as the methodology for the indicator was fixed after a track record of poor performance in conjunction with the government payroll report.
Jobs data is due from the Labor Department on Friday, and non-farm payrolls are expected to show an increase of 300,000 jobs last month after an increase of 528,000 jobs in July. Another strong report is likely to bolster expectations that the Federal Reserve will continue to raise interest rates significantly after three consecutive increases of 75 basis points.
Dow Jones Technical Analysis
Technically, the index continues to decline amid the dominance of the short-term bearish trend along a slope line. It affected by leaving the range of a bullish corrective price channel that had limited its previous trading, as shown in the attached chart for a (daily) period, and the index has crossed during the trading of this week its average support.
The simple mover for the previous 50 days, which represented the last chance to gain the necessary positive momentum to help him recover his recovery and rise again. This faded those hopes and doubled the negative pressures on it during its upcoming trading, especially with the continued influx of negative signals in the relative strength indicators. This is despite their stability in areas that are highly saturated with sales.
Therefore, our expectations indicate that the index will continue to decline during its upcoming trading, to target the first major support levels at 31,000. This negative scenario will remain valid as long as the resistance level 32,272.70 remains intact.
 Ready to trade our US 30 technical analysis? We’ve made a list of the best online CFD trading brokers worth trading with.

