Bearish view
- Sell the GBP/USD pair and set a take-profit at 1.1400.
- Add a stop-loss at 1.1650.
- Timeline: 1-2 days.
Bullish view
- Set a buy-stop at 1.1600 and a take-profit at 1.1760.
- Add a stop-loss at 1.1500.
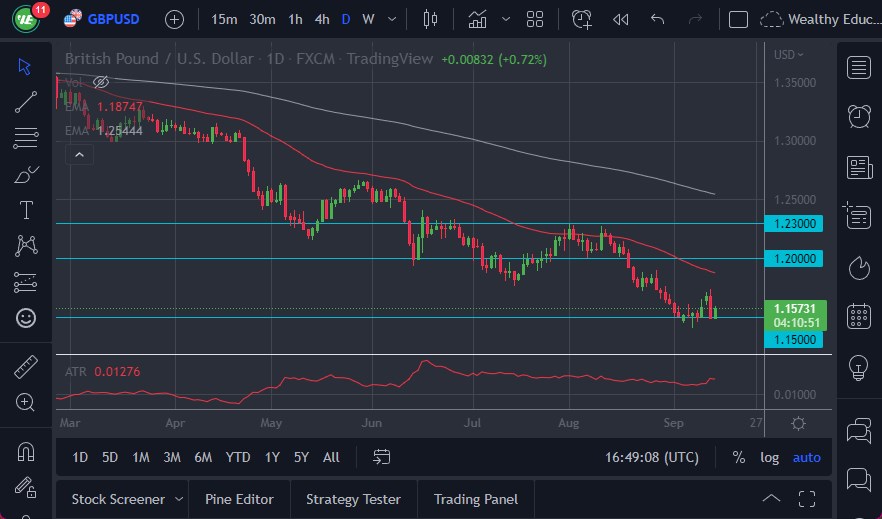
The GBP/USD price bounced back slightly after the latest UK and US inflation data. It rose to a high of 1.1570, which was higher than this week’s low of 1.1482. It has dropped by almost 20% from the lowest level this year.
UK inflation and US retail sales data
The GBP/USD price pulled back slightly after the latest US inflation data. According to the Office of National Statistics (ONS), the country’s consumer price index (CPI) dropped from 0.6% in July to 0.5% in August. This was a surprise decline since analysts were expecting inflation to rise by 0.6%.
The headline CPI declined from 10.1% in July to 9.9% in August on a year-on-year basis. It was also slightly lower than the median estimate of 10.2%. The so-called core CPI, which avoids food and energy, dropped from 6.7% to 6.6%.
Still, these numbers are not expected to change the tone of the Bank of England (BoE). Analysts believe that the bank will continue hiking interest rates aggressively. They are now pricing in a 50 basis point increase when it meets on Thursday next week.
For one, these inflation figures have been influenced by the government’s subsidies on energy. As such, inflation will likely remain at elevated levels when the subsidies end.
The GBP/USD pair also dropped as investors reacted to the significantly higher consumer and producer inflation data from the US. These numbers have reinforced the view that the Fed will continue hiking interest rates in its remaining meetings of the year.
The pair will next react to the US and UK retail sales data that are scheduled for Thursday and Friday, respectively. In addition, the US will also publish the latest industrial and manufacturing production data. Still, their impact will be limited because of the expected actions by the Fed.
GBP/USD forecast
The GBP/USD price has been in a strong downward trend in the past few months as the US dollar index surged to the highest point in more than 20 years. It is also hovering near its lowest level since the 1980s. The pair has moved below the important resistance level at 1.1763, which was the lowest level on July 14.
It has also moved below all moving averages and done a break and retest pattern by moving slightly below the key level at 1.1763. Therefore, the path of the least resistance for the pair is downwards, with the next key support level being at 1.1400.
 Ready to trade our free Forex signals? We’ve shortlisted the best Forex trading brokers in the industry for you.
