Bullish view
- Buy the BTC/USD pair and set a take-profit at 21,000.
- Add a stop-loss at 19,000.
- Timeline: 1-2 days.
Bearish view
- Set a sell-stop at 19,600 and a take-profit at 18,500.
- Add a stop-loss at 21,000.
The BTC/USD price rose to above 20,000 for the first time since October 7 as American stocks rebounded and bond yields slipped. Bitcoin rose to $20,200 as the mood in the market improved. This price was about 10% above the lowest level this month.
Bond yields retreat
Bitcoin and other risky assets bounced back as US Treasury yields dropped. Yield of the 10-year government bond dropped to 4.10% while the 30-year and 2-year yields fell to 4.26% and 4.47%, respectively.
Yields declined after the US published the latest house price index data. The numbers showed that the index dropped by 1.1% in August from July after falling by 0.3% in the previous month. As a result, the US dollar index slipped by more than 0.80%.
Bitcoin also rallied as American equities continued rallying. The Dow Jones and Nasdaq 100 indices rose by more than 1% after positive earnings. At the same time, there are signs that investors are getting more comfortable buying the dip. In a report, Bank of America said that its clients were net buyers of US stocks in the past six weeks.
There are other potential catalysts for the BTC/USD pair. First, there are signs that some buyers are accumulating at the current levels. According to Glassnode, small and large holders have changed their behavior from a net balance decline and distribution towards accumulation and balance increase.
Second, Bitcoin flows in exchanges has been positive while the number of HODLer wallets has risen to an all-time high. Also, many die-hard Bitcoin supporters have maintained their conviction about Bitcoin.
Meanwhile, the US dollar index has pulled back recently and is trading at $110. At its peak this year, the index was trading at $115.
BTC/USD forecast
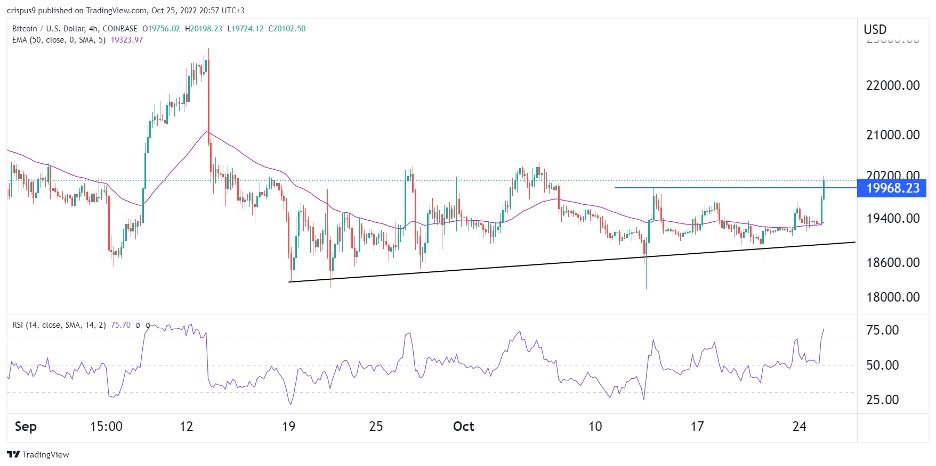
The BTC/USD price has been in a consolidation phase in the past few days. It managed to move above the key resistance at 19,968, which was the highest level on October 14. It also moved slightly above the psychological level of 20,000 while the Relative Strength Index (RSI) rose to the overbought level.
This price action means that Bitcoin may have found a floor that is shown in black and is above the 50-day moving average. Therefore, the pair will likely continue rising as bulls target the key resistance at 21,000.

Ready to trade our free Forex currency signals? Here are some excellent Forex brokers to choose from.
