Bullish view
- Buy the BTC/USD pair and set a take-profit at 21,200.
- Set a stop-loss at 19,000.
- Timeline: 1 day.
Bearish view
- Set a sell-stop at 19,500 and a take-profit at 18,500.
- Add a stop-loss at 21,000.
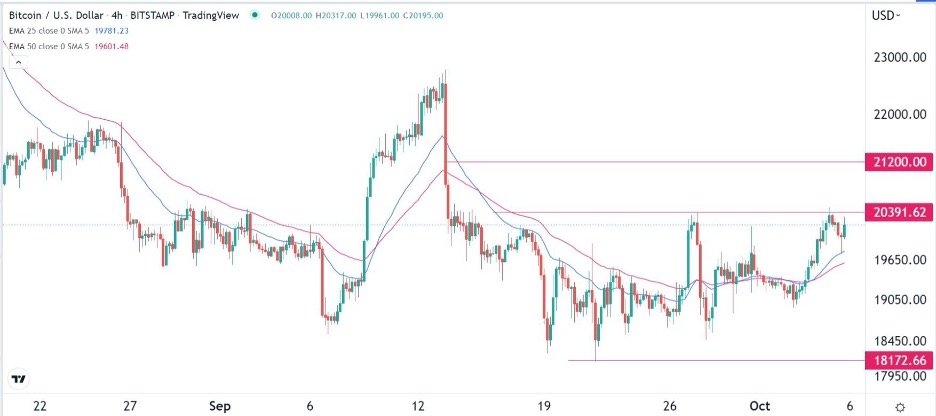
The BTC/USD price held steady at about 20,000 as the consolidation phase continued. It was trading at 20,150 on Thursday morning, which was much higher than last month’s low of $18,172. Other cryptocurrencies like ETH and LTC have also continued consolidating.
Bitcoin hash rate rises
The BTC/USD price has been in a tight range in the past few weeks as the market waits for the next catalyst. It has managed to outperform other assets like stocks and gold. In September, the main American indices like the S&P 500, Dow Jones, and Nasdaq 100 indices dropped by more than 10% as risks escalated.
While Bitcoin has consolidated, some on-chain metrics point to a potential upside. For one, Bitcoin’s supply in exchanges has dropped to the lowest level in months. This is usually a positive sign since it means that people are still buying while holders are not selling.
Another important data is Bitcoin’s hash rate, which has risen to the highest level on record. The hash rate rose to 260 TH/s, which was much higher than where it was in September. It has risen by more than 72% since the same time in 2021.
A likely reason for this rising hash rate is that many miners who were focused on Ethereum have now moved to BTC. Another reason could be that miners have been upgrading their mining hardware as mining difficulty rises. This is likely not the case since mining profitability has crashed to the lowest level in years.
The BTC/USD price has also tilted upwards because of the falling US dollar. After rising to a multi-decade high of $115 in September, the US dollar index has pulled back to about $111 ahead of the upcoming non-farm payrolls data.
BTC/USD forecast
The four-hour chart shows that the BTC/USD pair has been in a slow upward trend in the past few days. It rose to a high of 20,391 on Wednesday. This was an important level since it was the highest level on September 27. The pair has moved above the 25-day and 50-day moving averages. Oscillators like the Relative Strength Index (RSI) and the MACD have continued rising.
Therefore, the pair will likely continue rising now that it has formed a small hammer pattern. If this happens, the next key resistance point to watch will be 21,200.
 Ready to trade our free daily Bitcoin signals? We’ve shortlisted the best MT4 crypto brokers in the industry for you.
