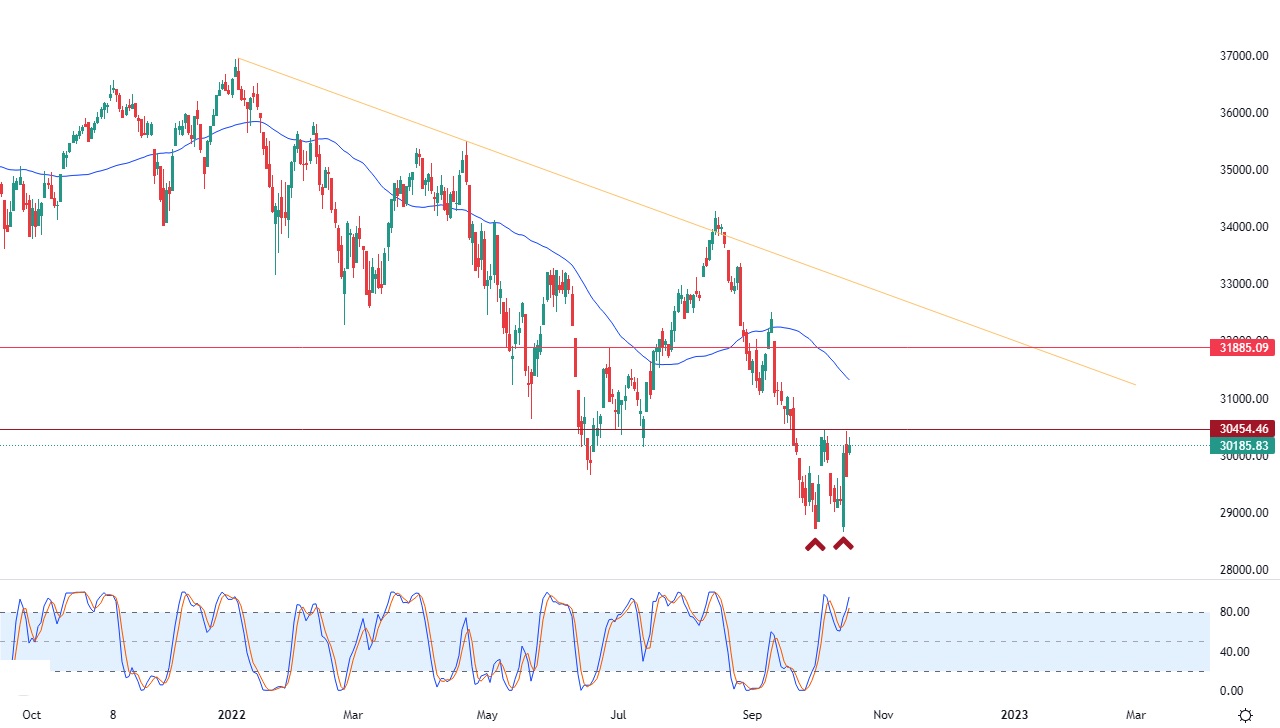
- The Dow Jones Industrial Average rose again in its recent trading at the intraday levels.
- It achieved gains in its last sessions by 1.86%, to gain about 550.99 points, to settle at the end of trading at the level of 30,185.83.
- This happened after it declined during last Friday's trading by -1.34 %, after recording a gain of 1.15% in trading last week.
US stocks started the trading week higher on Monday, after Britain reversed course on an economic plan. Bank of America was the latest financial company to report strong quarterly results, raising optimism about the quarterly corporate earnings season.
Data on manufacturing in the New York region was weaker than expected, adding further expectations that future Fed policies could be centered.
The New York Fed's Empire State Manufacturing Index posted its third negative reading in a row, falling 7.6 points to minus 9.1 in October, compared to expectations of a fall by 5 points.
Earnings season set to rebound after a round of earnings reports from major Wall Street banks on Friday. Investors welcomed Monday's results from Bank of America, and Goldman Sachs Group Inc. GS on Tuesday.
Dow Jones Technical Analysis
Technically, the index is preparing, with its recent rise, to attack the important 30,454.46 resistance level, as this level represents the ceiling of a positive technical structure that is being formed in the short term. It is the double bottom pattern, as shown in the attached chart for a (daily) period, supported by the influx of positive signals on the relative strength indicators, Despite its access to areas of severe saturation of purchases.
But in front of that, the downside corrective trend dominates the index's movement in the short term and along a slope line, and at the same time, it suffers from the continuation of negative pressure due to its trading below the simple moving average for the previous 50 days.
Therefore, our expectations suggest that the index will rise during its upcoming trading, but on the condition that it first breaches the 30,454.46 resistance level, in order to confirm the validity of the formed double bottom pattern. Afterward it will target the 31,885.00 resistance level as a price target for this formed pattern.

Ready to trade our US 30 technical analysis? We’ve made a list of the best online CFD trading brokers worth trading with.
