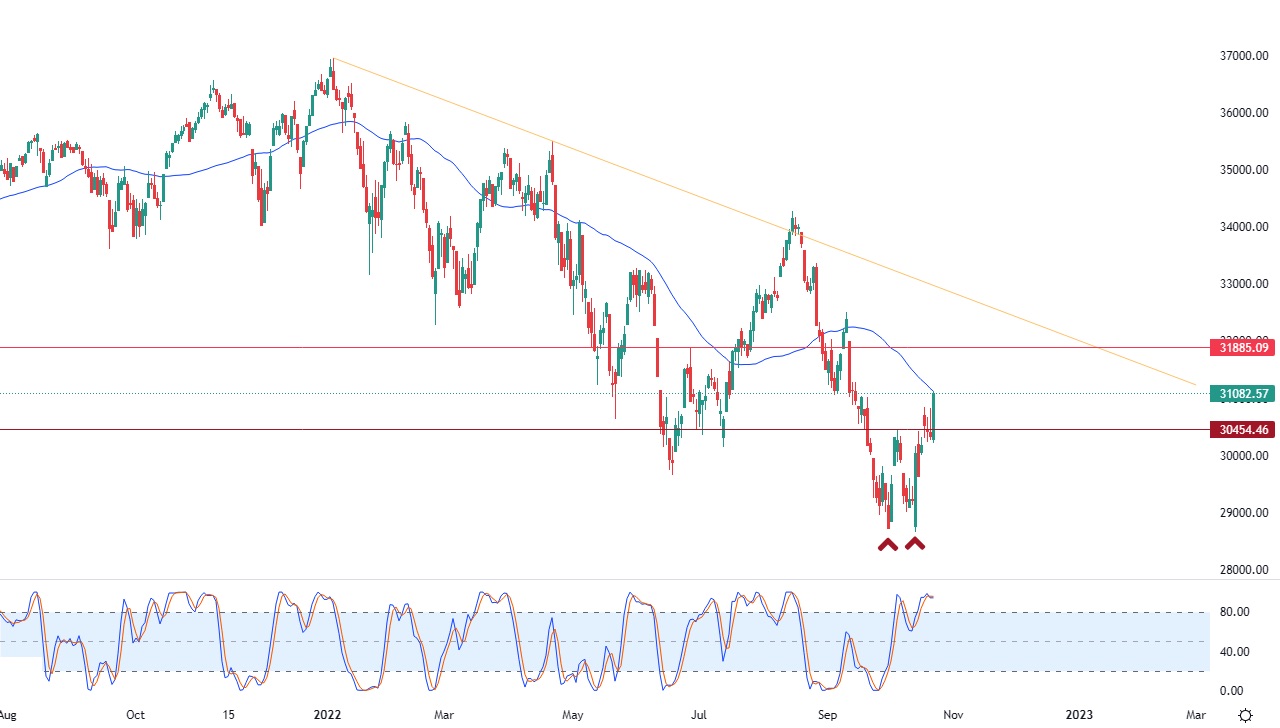
- The Dow Jones Industrial Average jumped in its recent trading at the intraday levels, to achieve sharp gains in its last sessions, by 2.47%, to gain about 748.97 points.
- It settled at the end of trading at the level of 31,082.57, after declining in Thursday's trading by -0.30%, during the last week the index rose by 4.9%, which is the strongest weekly gain since last June.
- The Fed certainly doesn't look like it's going to cut rates anytime soon. Especially at their November 2 meeting, Chairman Jerome Powell & Co. appears intent on raising the Fed funds rate by another 0.75 percentage point for the fourth time. respectively, raising the target range from 3.75% to 4%.
Even after the Wall Street Journal reported that the Fed was considering slowing the pace of interest rate hikes, pricing of the Fed's futures contracts dampens the likelihood of another increase by at least a percentage point by mid-2023.
Most of the real economy did not feel the effects of this tightening outside particularly interest rate sensitive sectors such as housing. Unemployment is at 3.5% and many measures of activity are still in expansion territory, history shows that stocks tend to fall once a recession starts which is why it looks like we are not there yet.
Meanwhile, San Francisco Fed President Mary Daly said monetary policy officials should start planning to cut interest rate hikes, but nonetheless stressed that it was not yet time to stop raising them completely.
Dow Jones Technical Analysis
Technically, the index succeeded in stabilizing above the important 30,454.46 resistance level, as this level represents the ceiling of a positive technical structure formed earlier in the short term. This is the double bottom pattern, as shown in the attached chart for a (daily) period, which pushed the index to the last rise to try in turn to get rid of the negative pressure of the simple moving average for the previous 50 days. In front of that the main dominant trend remains the bearish corrective trend in the short term, with the start of negative crossover on the RSI indicators, after reaching overbought areas.
Therefore, we expect more rise for the index during its upcoming trading, with an important condition, which is the stability of its trading above the level of 30,454.46, to target the 31,885.00 resistance level as a price target for the formed double bottom pattern.

Ready to trade our US 30 technical analysis? We’ve made a list of the best online CFD trading brokers worth trading with.
