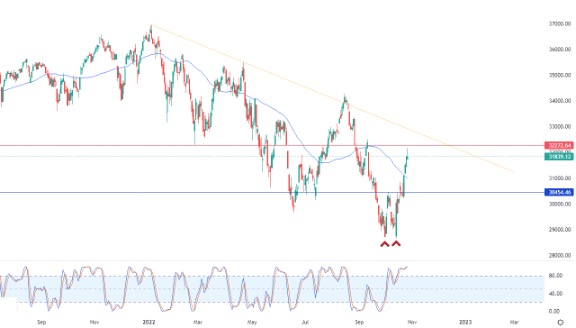
The Dow Jones Industrial Average rose slightly during its recent trading at the intraday levels. It achieved slight gains for the fourth consecutive session, by 0.01%, to add to it about 2.37 points only, settling at the end of trading at the level of 31,839.12.
The index rose in early morning trading after the Bank of Canada's decision to raise interest rates less than expected. This fueled hopes that the Federal Reserve may finally be less aggressive in raising interest rates.
Speculation about the possibility of the Federal Reserve reducing the size of its interest rate increases in December mounted. They expect another big jump of 75 basis points when policy makers meet next week.
But the index quickly bounced back to pare many of those early gains on the back of disappointing earnings reports from tech giants Microsoft MSFT and Alphabet parent company Google.
In US economic data, the trade deficit in goods widened 5.7% in September to $92.2 billion as a strong dollar hampered exports.
New home sales slowed to an annualized rate of 603,000 in September from 677,000 in the previous month. However, this is still higher than the 580,000 forecast in a Bloomberg survey.
Dow Jones Technical Analysis
- Technically, the index’s rise comes amid its continuous attempts to correct the main bearish trend in the short term.
- This was considering its trading along a bearish slope line, as shown in the attached chart for a (daily) period and supported in this rise by its continuous trading above its simple moving average for the previous 50 days.
- I also was affected by a positive technical structure formed earlier in the short term, which is the double bottom pattern.
But in front of that, we notice that the relative strength indicators have reached areas that are highly saturated with overbought operations. This strength is exaggerated compared to the movement of the index, which suggests the beginning of negative divergence in it, especially with the beginning of a negative crossover in it.
Therefore, our expectations suggest a return to the index's decline during its upcoming trading, especially throughout the stability of the pivotal 32,272.64 resistance level, to target the 30,454.46 support level.

Ready to trade our US 30 technical analysis? We’ve made a list of the best online CFD trading brokers worth trading with.
