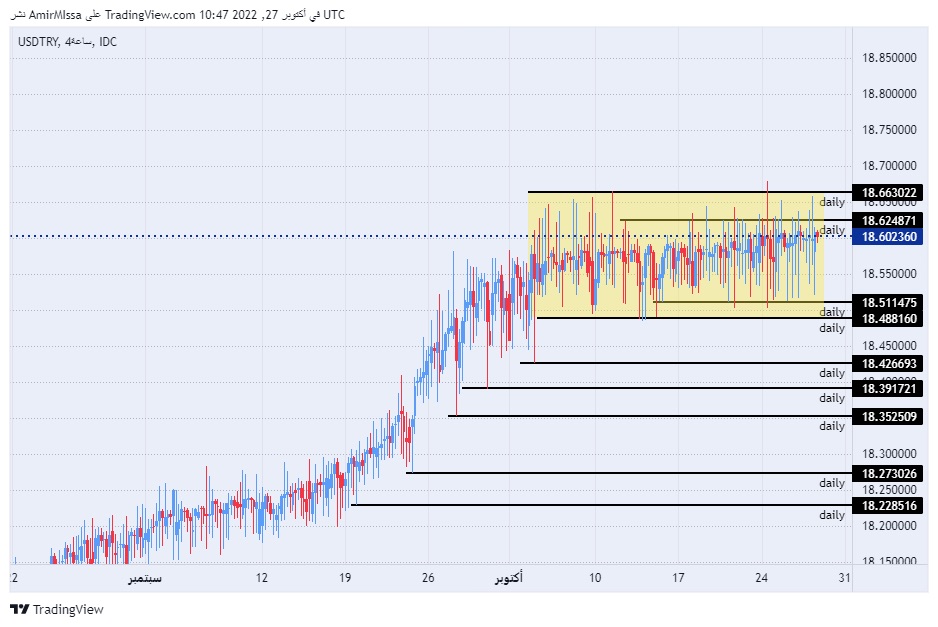
Today's recommendation on the TRY/USD
Risk 0.50%.
Best buying entry points
- Entering a long position with a pending order from levels of 18.50
- Set a stop-loss point to close below the 18.35 support level.
- Move the stop loss to the entry area and continue to profit as the price moves by 50 pips.
- Close half of the contracts with a profit of 70 pips and leave the rest of the contracts until the strong resistance levels at 18.99.
Best-selling entry points
- Entering a short position with a pending order from levels of 18.99
- The best points for setting stop-loss are closing the highest levels of 19.15.
- Move the stop loss to the entry area and continue to profit as the price moves by 50 pips.
- Close half of the contracts with a profit equal to 70 pips and leave the rest of the contracts until the 18.55 support level.
The exchange rate of the USD/TRY did not change during the early trading Thursday morning. The Turkish Central Bank revised inflation expectations to 65.2% by the end of this year, compared to 60.4% in previous estimates. The Governor of the Bank also admitted that the policy of the Turkish Central Bank was not sufficiently successful in controlling the expansion of the inflation rate. It is noteworthy that inflation in Turkey has recorded the highest levels since 1998, according to official data, which showed that the volume of inflation in the country has reached 83.44%, as the stimulus fiscal policy pursued by the Central Bank contributed to decreasing the value of the lira and raising the inflation rate, contrary to what the Central Bank and the President claim.
TRY/USD Technical Analysis
On the technical front, the price of the Turkish lira settled against the US currency near the pair's record highs, after it rose to levels of 18.68 before retreating. The pair is trading the highest levels of support, which are concentrated at levels of 18.51 and 18.42, respectively. On the other hand, the lira is trading below the resistance levels at 18.66 and 18.99, respectively. The pair continued to trade within a narrow trading range that has continued throughout the current month.
In the meantime, the pair is trading above the 50, 100 and 200 moving averages on the daily time frame, indicating the general bullish trend, while the pair is trading between these averages on the four-hour time frame. Also, on the 60-minute time frame, which shows the extent of volatility and trading in the narrow range that the pair is recording. Any drop for the pair represents an opportunity to buy back again with the aim of reaching the previous high recorded during the past year. Please adhere to the numbers in the recommendation with the need to maintain capital management.

Ready to trade our free Forex signals? We’ve shortlisted the best Forex trading brokers in the industry for you.
