The difference between success and failure in Forex / CFD trading is highly likely to depend mostly upon which assets you choose to trade each week and in which direction, and not on the exact methods you might use to determine trade entries and exits.
So, when starting the week, it is a good idea to look at the big picture of what is developing in the market as a whole, and how such developments and affected by macro fundamentals, technical factors, and market sentiment. There are very strong trends in the market right now, which can be easy to exploit profitably. Read on to get my weekly analysis below.
Fundamental Analysis & Market Sentiment
I wrote in my previous piece on 25th September that the best trades for the week were likely to be:
- Short of the GBP/USD currency pair. The price rebounded very strongly later in the week, giving a large loss of approximately 2.81%.
- Short of the EUR/USD currency pair. The price rebounded strongly later in the week, giving a loss of approximately 1.17%.
The news is dominated by the ongoing bear market in stocks, which has seen the benchmark S&P 500 Index and the NASDAQ 100 end the week at near 2-year lows and showing bearish momentum. Major global indices are also lower, notably the Chinese HSI which has reached a 10-year low. Risk sentiment is poor, and the US Dollar retains strength as a safe haven for the inflow of formerly speculative funds, with the 2-year and 10-year US treasury yields reaching new long-term highs. The gloomy sentiment is boosted by the US Federal Reserve taking a more hawkish tilt a couple of weeks ago, and the continuing hints of disagreement between members expressed publicly how fast rate hikes should now be implemented. The Dollar also got a boost Friday as US Core PCE Price Index data showed a stronger increase than had been expected.
Global attention has also turned back to the war in Ukraine as Russia held a referendum exercise in some of the occupied areas on the question of annexation. Putin gave a strongly anti-western speech and again threatened to use nuclear weapons, by implication including in defense of the newly annexed areas. However, these developments come as Ukrainian forces are beginning to win significant victories over Russian forces in the occupied areas.
The UK was in the news over the past week as the new Truss government announced a mini budget centered on a plan to implement the largest tax cuts since World War Two. The plan was criticized by the IMF and ratings agencies, and has faced very strong opposition at home, partly because it is to be financed by massive government borrowing. The motive for the plan is to attempt to dramatically boost UK growth, which has been low for many years. The news sent the British Pound sharply lower, with the GBP/USD currency pair opening the week with a very dramatic fall to an all-time low price at $1.0350. The volatility of this plunge was huge and had not been seen since the Brexit referendum result – the price fell by approximately one thousand pips in two days. However, after reaching this record low, the Pound recovered just as strongly, and ended well up on the week. The Euro also recovered against the Dollar, so it is notable that the commodity currencies (AUD, NZD, CAD) remained very weak against the greenback.
The details of the important economic data releases last week can be summarised as follows:
- US Core PCE Price Index data – this showed a month-on-month increase of 0.6%, higher than the 0.5% which had been expected, suggesting that US inflation remains persistent
- US CB Consumer Confidence data – this came in higher than expected, at 108 compared to the expected 104, suggesting there is still strong demand in the US economy
- Canadian GDP data – this was slightly better than expected, showing a month-on-month increase of 0.1% compared to an expected shrinkage of 0.1%
The Forex market saw relative strength in the British Pound, the Euro, and the US Dollar last week. The weakest currencies were the AUD, the NZD, and the CAD.
Rates of coronavirus infection globally dropped last week for the eleventh consecutive week. The only significant growths in new confirmed coronavirus cases overall right now are happening in Austria, Germany, and Taiwan.
The Week Ahead: 3rd October – 7th October 2022
The coming week in the markets is likely to see a continuing high level of volatility, with several major data releases due compared to the quiet previous week. Releases due are, in order of likely importance:
- US Non-Farm Employment Change, Unemployment Rate, Average Hourly Earnings
- US ADP Non-Farm Employment Change Forecast
- Swiss CPI (inflation)
- US ISM Services PMI data
- US ISM Manufacturing PMI data
- RBA Cash Rate & Rate Statement
- RBNZ Official Cash Rate & Rate Statement
- US JOLTS Job Openings
- OPEC Meetings
- Canadian Unemployment Rate & Employment Change
It is a public holiday this Monday 3rd October in Germany and Australia. It is a public holiday the entire week in China.
Technical Analysis
U.S. Dollar Index
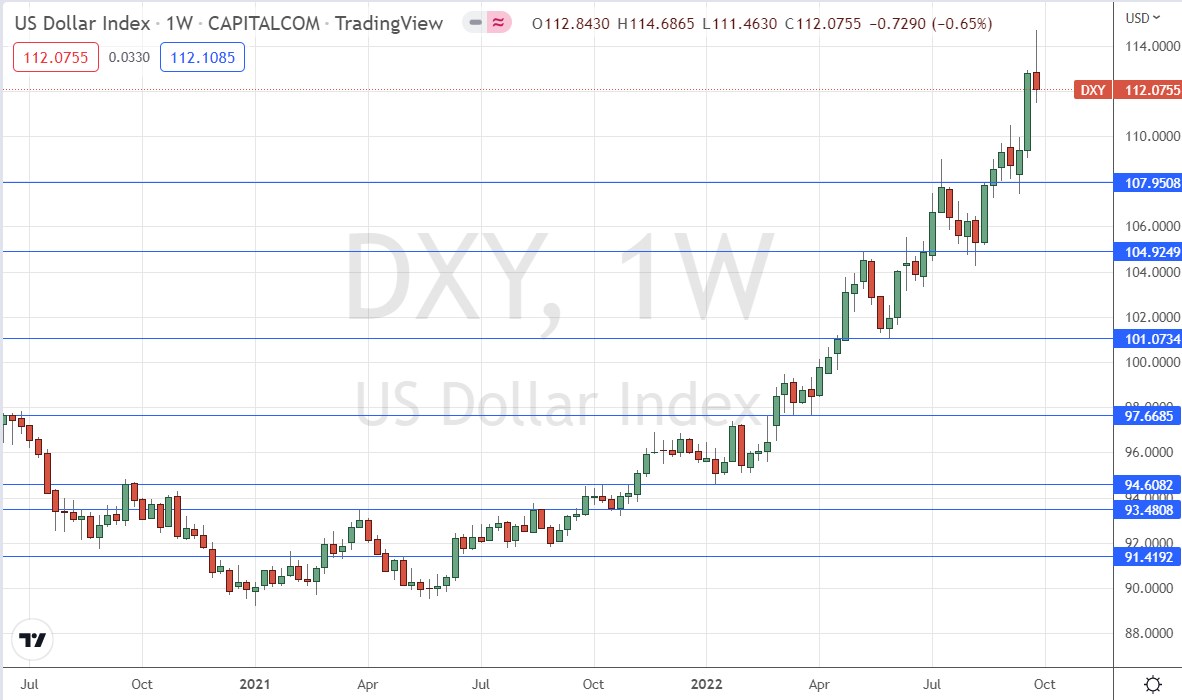
The weekly price chart below shows the U.S. Dollar Index printed a bearish near-hammer candlestick which closed down but with some notable lower wick and without even coming close to closing in the lower half of the previous week’s range. This suggests that short-term price movement by the Dollar looks uncertain, but there is no question that the long-term trend is very bullish. Before falling, last week saw the Dollar Index reach its highest level in more than a decade.
The Dollar is remaining strong against some currencies but lost a lot of ground against a resurgent British Pound and Euro, which came bouncing back after making strong falls. So, the Dollar retains a lot of strength, but the strengths are mixed.
We may have a new support level formed at a recent bearish inflection level confluent with 110.00.
It may be a good idea to stand aside or to only look for long trades in the US Dollar over the coming week. This is a very powerful, long-term bullish trend in the most important currency in the Forex market.
NASDAQ 100
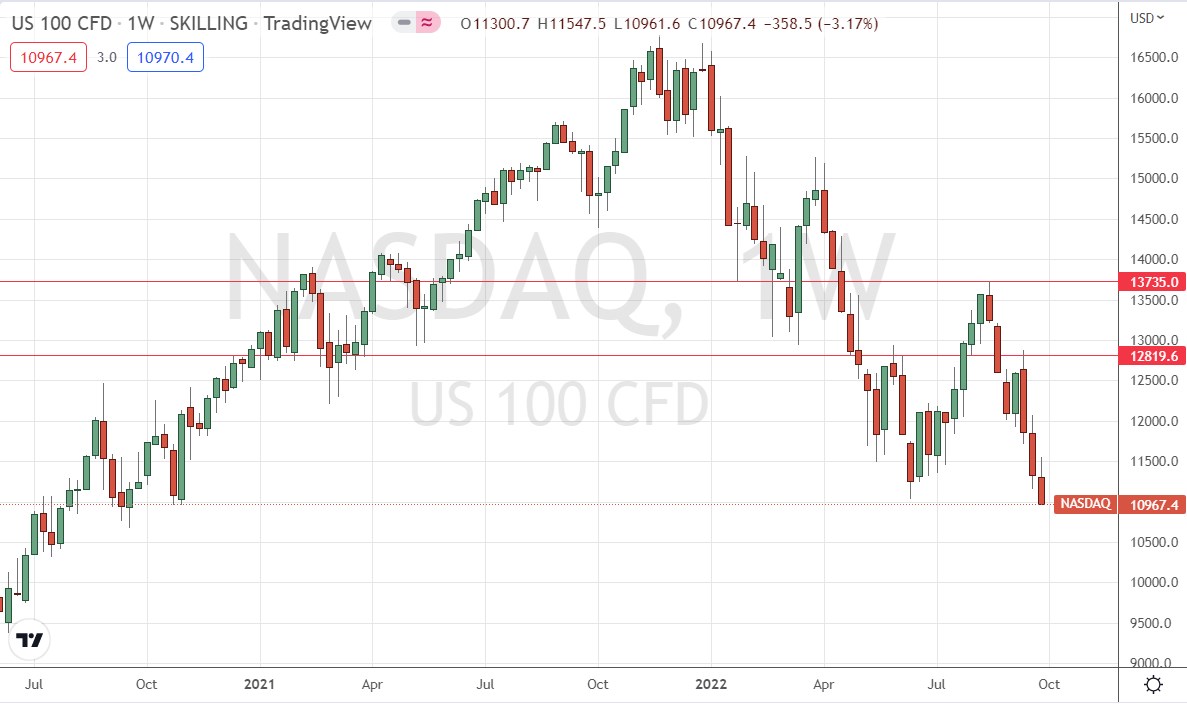
The NASDAQ 100 tech index fell strongly last week to make a near 2-year low price, printing a firmly bearish candlestick closing right on its low, as all major global stock indices had a very bad week. Global stocks have taken a serious beating due to the persistently high inflation data we are seeing in the US and the consequential hawkish tilts the Federal Reserve is constantly making as their expectations are continuously proven again and again to be somewhat over-optimistic.
I do not like to trade stocks short, as they are prone to sudden and strong bullish reversals, but there may be continuing opportunities here on the short side if we continue to see strong bearish momentum as markets open on Monday.
S&P 500
The S&P 500 Index fell strongly last week to make a near 2-year low price, printing a firmly bearish candlestick closing right on its low, as all major global stock indices had a very bad week. Global stocks have taken a serious beating due to the persistently high inflation data we are seeing in the US and the consequential hawkish tilts the Federal Reserve is constantly making as their expectations are continuously proven again and again to be somewhat over-optimistic.
I do not like to trade stocks short, as they are prone to sudden and strong bullish reversals, but there may be continuing opportunities here on the short side if we continue to see strong bearish momentum as markets open on Monday.

GBP/USD
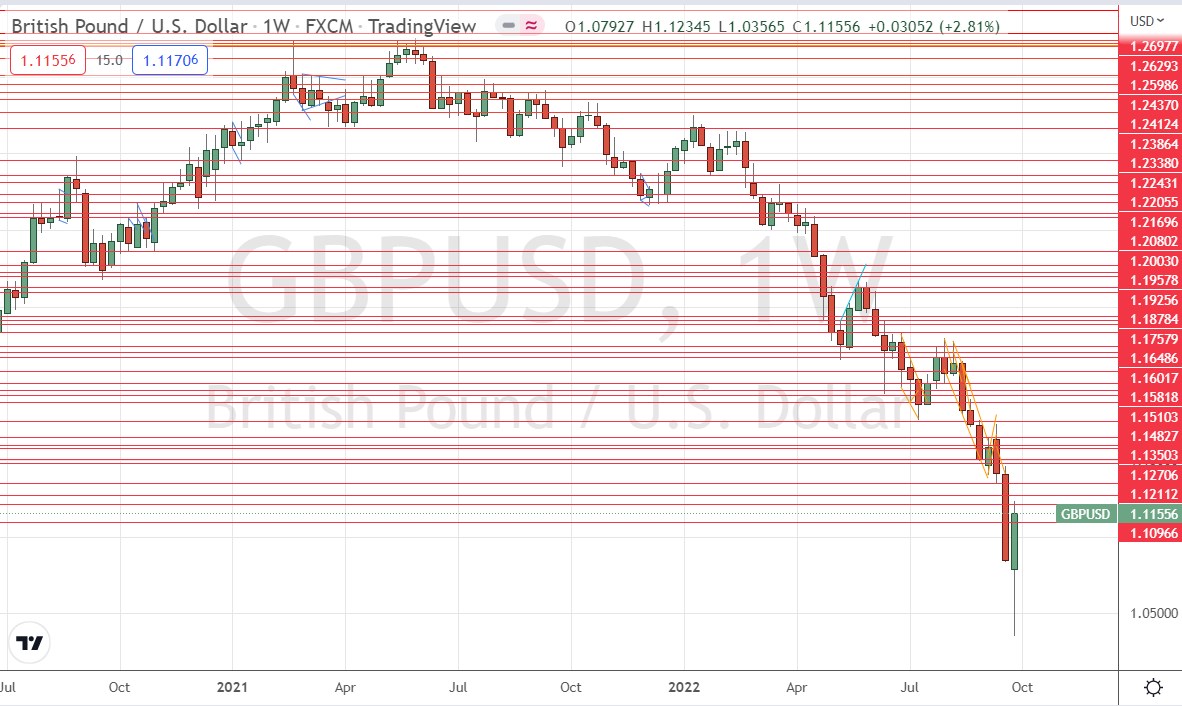
Last week saw the GBP/USD currency pair make a huge fall by hundreds of pips during Monday’s Asian session alone, to reach a new all-time low at $1.0350 before recovering so strongly that it closed the week significantly higher. This is a good example of how prices can make long-term lows or highs on massive volatility spikes, which the price then tends to recover from equally strongly.
The proximate cause of the Pound’s sharp drop was the surprise announcement of a massive program of tax cuts to be financed by government borrowing, and the market reacted very negatively to the news. However, it seems that the Pound found strong long-term buyers at this record low.
Another interesting factor here is the way the US Dollar has retained strength, but not against the Pound or Euro. This is also suggesting of strong buying, especially in the Pound.
Long-term investors may find the Pound an interesting buy but should be prepared for some short-term turbulence as the current strong price movements work themselves out.
USD/JPY
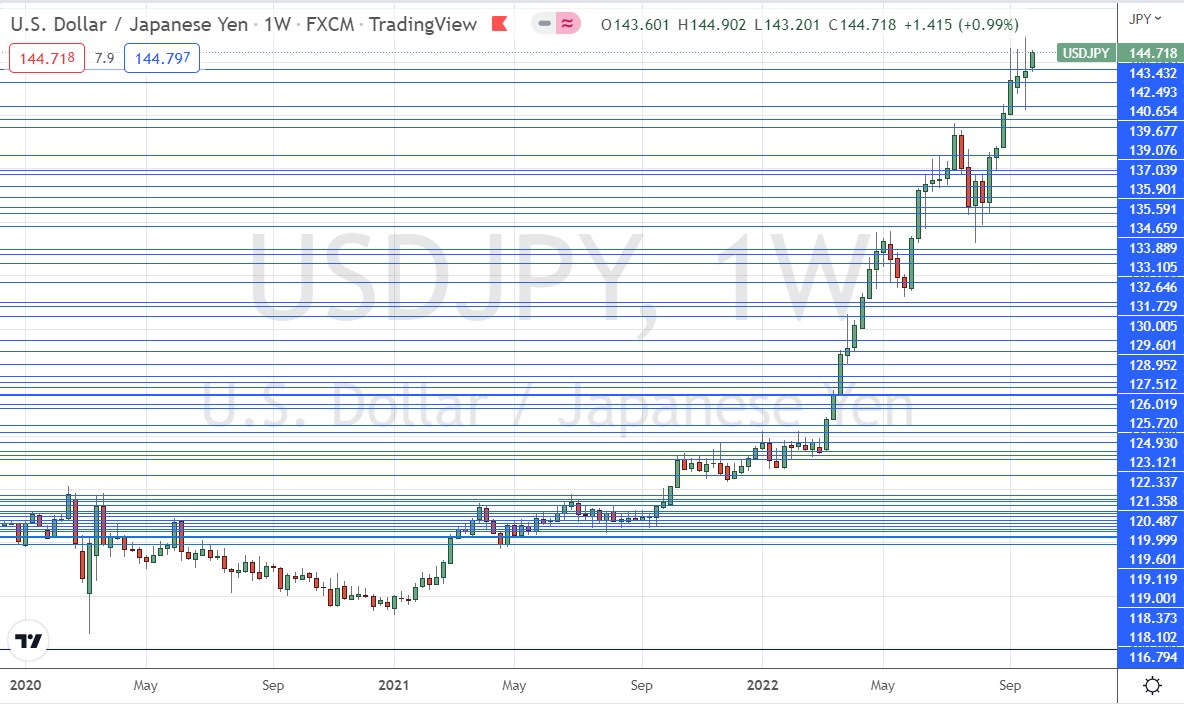
Last week saw the USD/JPY currency pair print a bullish inside candlestick which made the highest weekly close since 1998. The closing price was right at the high of the week. These are bullish signs.
This currency pair is worth keeping an eye on this week, as the US Dollar remains strong but loses ground to the British Pound and the Euro. A look at the price chart below shows that this pair is in a very strong long-term bullish trend. The problem for bulls is that the Bank of Japan does not want to see the price above the ¥145 handle, so has intervened at this area to stop any new advance beyond it. However, it looks like the price will try to push up this week, begging the question of whether the Bank of Japan can stop it if they want to.
I believe that at least over the short-term that the Bank of Japan will continue intervening when the price gets above ¥145, so there could be good short-term short trade opportunities here. The problem is that when central banks intervene spreads widen dramatically and prices move extremely quickly, making it difficult to jump on the bandwagon effectively.
There is also a potential long trade opportunity here that may require a lot of patience, but if the Bank of Japan’s intervention fails, the price could make a dramatic breakout beyond ¥145 and even reach ¥150 rapidly.
NZD/USD
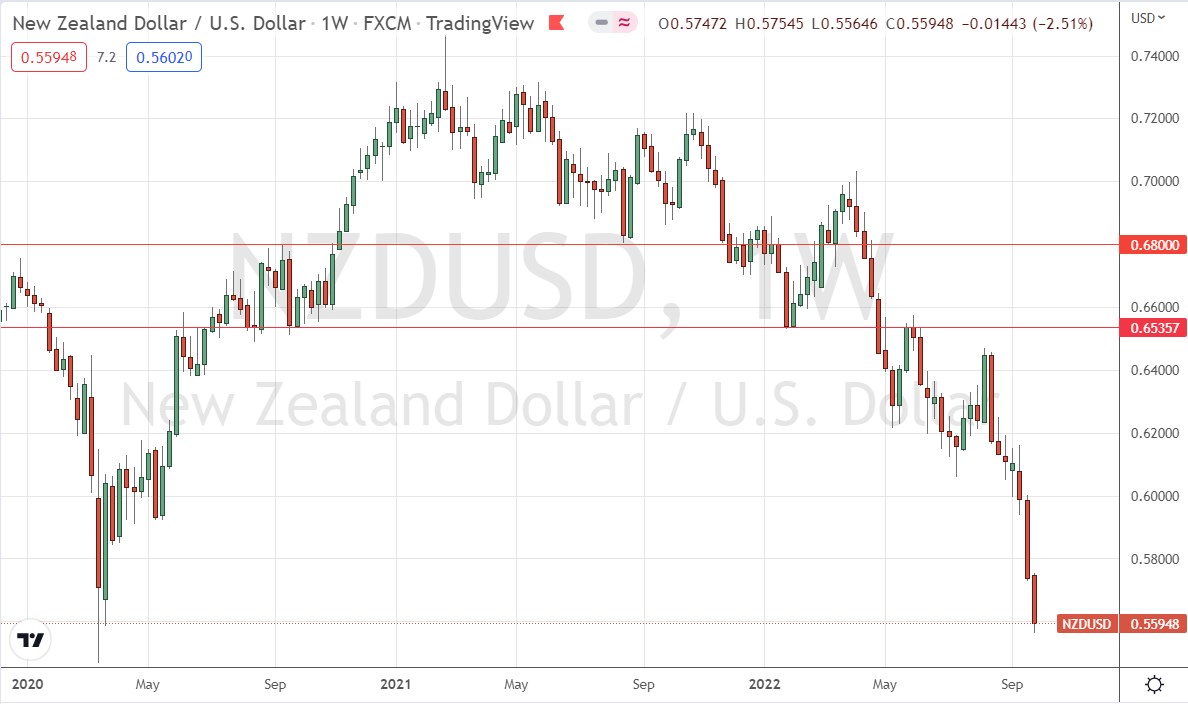
Last week saw the NZD/USD currency pair print a fairly large bearish candlestick which saw the currency pair reach its lowest price since the coronavirus panic of May 2020, and make its lowest weekly close in more than a decade. The candlestick closed right on its low. This and the fact that the New Zealand Dollar is continuing to drop by more than most other currencies are bearish signs.
Despite the bearish picture, the technical situation is not fully bearish, as the price is still within the area between $0.5450 to $0.5600, which could be very supportive as it acted as a strong inflection point in 2020.
It is interesting to note that the relatively high interest rate in the NZD is not saving it from declining to fresh long-term lows. The weakness in this currency stands out.
Bottom Line
I see the best opportunities in the financial markets this week as likely to be short of the NZD/USD currency pair and long of the USD/JPY currency pair.
Ready to trade our Forex weekly analysis? We’ve shortlisted the best Forex trading brokers in the industry for you.

