Previous BTC/USD Signal
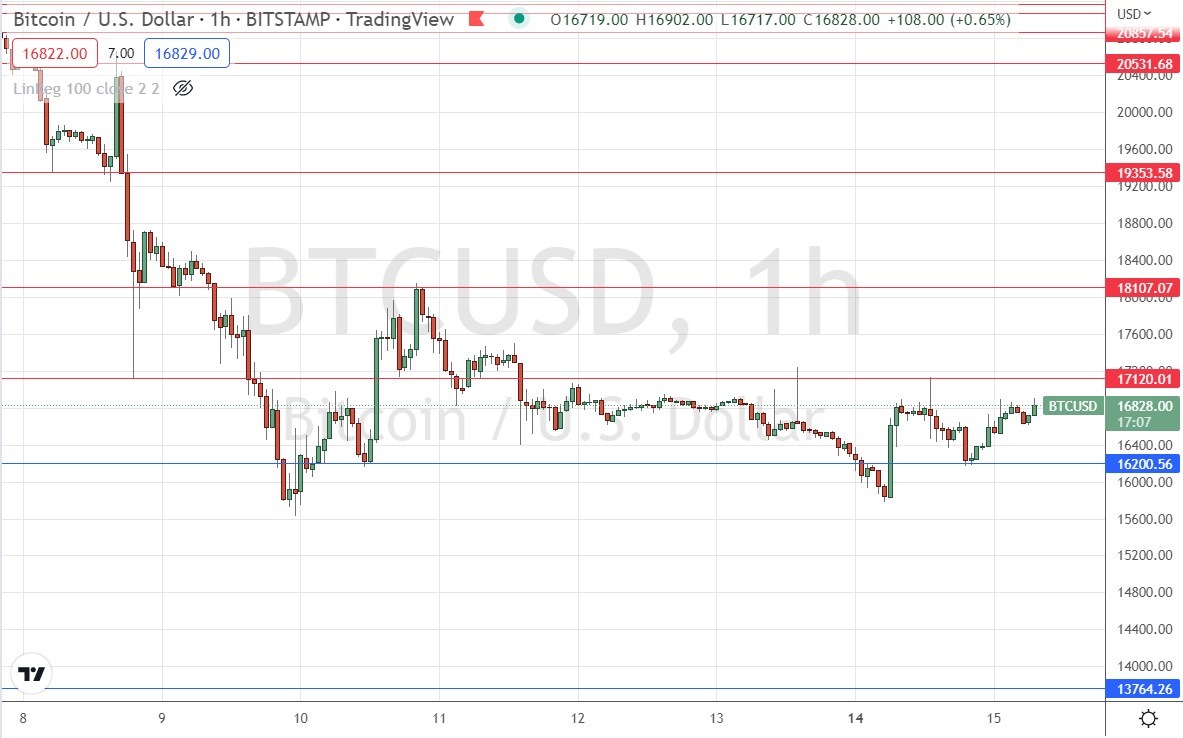
My previous Bitcoin signal on 8th November produced a nicely profitable short trade when the resistance level which I had identified at $20,532 was rejected by a large bearish engulfing candlestick.
Today’s BTC/USD Signals
Risk 0.50% per trade.
Trades may only be entered before 5pm Tokyo time Wednesday.
Long Trade Ideas
- Go long after a bullish price action reversal on the H1 timeframe following the next touch of $16,201 or $13,764.
- Place the stop loss $100 below the local swing low.
- Adjust the stop loss to break even once the trade is $100 in profit by price.
- Adjust 50% of the position as profit when the trade is $100 in profit by price and leave the remainder of the position to run.
Short Trade Ideas
- Go short after a bearish price action reversal on the H1 timeframe following the next touch of $17,120, $18,107, $19,954 or $20,532.
- Place the stop loss $100 above the local swing high.
- Adjust the stop loss to break even once the trade is $100 in profit by price.
- Take off 50% of the position as profit when the trade is $100 in profit by price and leave the remainder of the position to run.
The best method to identify a classic “price action reversal” is for an hourly candle to close, such as a pin bar, a doji, an outside or even just an engulfing candle with a higher close. You can exploit these levels or zones by watching the price action that occurs at the given levels.
BTC/USD Analysis
I wrote in my previous analysis on 8th November that the price of BTC/USD looked likely to
continue its existing dull consolidation pattern over the near term, giving a potential long trade opportunity from $19,463, although I thought there was not much action here worth getting involved in.
I think my forecast would have been a good call if it had not been overtaken by events which generated a dramatic bearish market movement, namely the start of the collapse of the crypto exchange FTX. This has been a shocking tale of naivete, incompetence, and possible political protection – FTX were heavy donors to the Democratic Party in the USA since 2020, which could be seen to have shielded them from a well-deserved investigation.
The news emerging from FTX pushed the price of Bitcoin into a strong breakdown to new 2-year lows which had been a long time in coming.
The price fell as low as the $15,600 area within 24 hours, and I expected that the price would continue to fall to the next key support level below $14k giving a good short trade opportunity. However, we have seen the price refuse to make a lower low, and instead consolidate below the new resistance level at $17,120. Despite this bearish sign, we are seeing new support holding up the price not far from $16k, as shown in the price chart below.
I think the best opportunities over the medium-term are likely to be on the short side, but over the short-term it seems very hard to predict the price movement.
I am prepared to take a short trade from a firm bearish candlestick pattern rejecting any of the resistance levels that I mention above, as I think despite the continued willingness of long-term hodlers to cling on for dear life, new lows are likely to happen here sooner or later.

Concerning the US Dollar, there are release of PPI and the Empire State Manufacturing Index data scheduled today.
Ready to trade our free trading signals? We’ve made a list of the best Forex crypto brokers worth trading with.
