Bearish view
- Sell the BTC/USD pair and set a take-profit at 19,500.
- Add a stop-loss at 21,000.
- Timeline: 1 day.
Bullish view
- Set a buy-stop at 20,800 and a take-profit at 21,500.
- Add a stop-loss at 19,500.
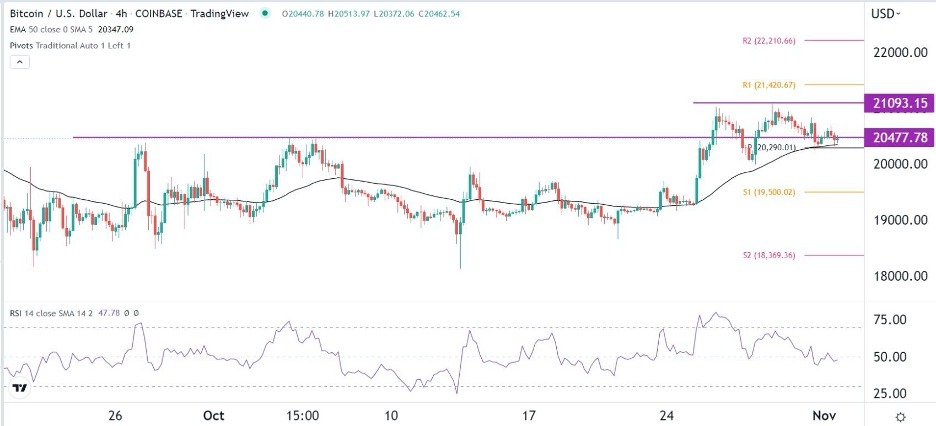
The BTC/USD price remained in a consolidation mode in the overnight session as last week’s momentum faded. Bitcoin was trading at $20,477 on Wednesday morning, in the range where it has been in the past few days. This price is about 12% above the lowest level in October.
Focus shifts to the Federal Reserve
Bitcoin staged a strong rally in the final week of October as investors started pricing in a Fed pivot. This price action, which was the first relief rally since September, coincided with the strong performance of the stock market. Key American indices like the Dow Jones and Nasdaq 100 also rallied by double digits in October.
Bitcoin’s rally faded this week as investors focused on the upcoming monetary policy meeting by the Federal Reserve. This also explains why American stocks have pulled back while the US dollar and VIX index have bounced back in the past few days.
Based on the last meeting’s dot plot and the most recent statements by some Fed officials, analysts are pricing in a 75 basis point rate hike. As such, the main rate hike will not have an impact on the BTC/USD pair.
Instead, the main catalyst for Bitcoin will be the accompanying statement and the dot plot. The dot plot is a document that shows where FOMC officials expect interest rates to move in the coming months. Signs of a pivot will likely be bullish for Bitcoin and stocks.
Still, there are signs that the Fed will maintain its hawkish tone. For one, the American economy is doing well, with the labor market doing well. GDP data published last week showed that the economy rebounded in Q3 while manufacturing PMI doing well.
Also, the Fed will likely sound hawkish to prevent the stock and crypto markets from getting ahead further.
BTC/USD forecast
The four-hour chart shows that the BTC/USD pair has been in a tight range in the past few days. It remains slightly below this week’s high of 21,093. The pair is slightly above the 50-day moving average while the Relative Strength Index (RSI) has formed a bearish divergence pattern.
It has also formed a double-top pattern. Therefore, there is a possibility that the pair will continue falling as sellers target the key support level at 19,500. The stop-loss of this trade will be at 21,000.
 Ready to trade our free signals? Here are the best MT4 crypto brokers to choose from.
