Bearish view
- Sell the EUR/USD pair and set a take-profit at 0.9900.
- Add a stop-loss at 1.0065.
- Timeline: 1 day.
Bullish view
- Buy the EUR/USD pair and set a take-profit at 1.0095.
- Add a stop-loss at 0.9900.
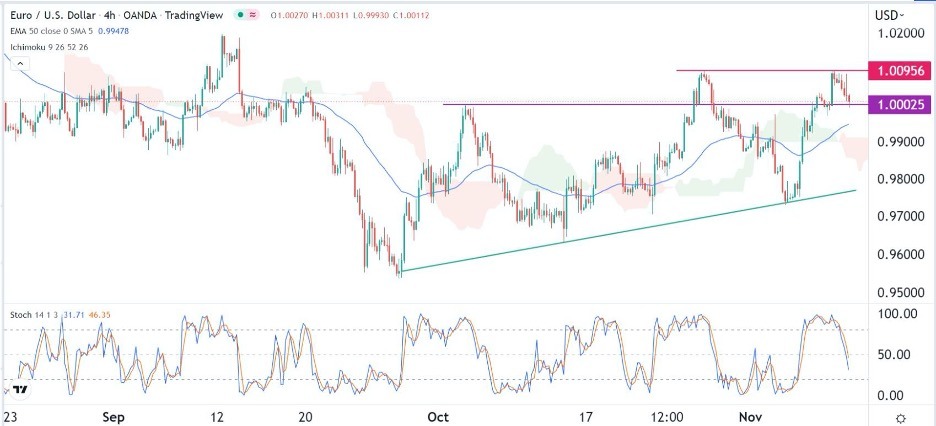
The EUR/USD price collapsed below the parity level as the US dollar rebounded. It was trading at 0.9996, the lowest level since Friday last week. The price is slightly below this week’s high of 1.0095 ahead of the upcoming American inflation data.
US inflation data ahead
The EUR/USD pair has pulled back in the past few hours as investors reflected on the results of the American midterm election. The results were significantly tighter than what most polls were expecting.
Still, the division of power in Washington means that Joe Biden will likely have a difficult two years passing deal in Congress.
The pair also declined as market risks continued. The biggest risk in the market this week was in the cryptocurrency industry, where FTX collapsed. At its peak, FTX was one of the biggest exchanges in the world, with a valuation of over $32 billion. It was also a survivor that rescued several companies like Voyager Digital and BlockFi.
The other risk is that the Fed will continue hiking interest rates in the coming months. It hiked rates by 75 basis points last week and pushed them to 400 basis points. And last Friday, data by the Bureau of Labor Statistics showed that the economy added more than 230k jobs while the unemployment rate rose to 3.7%.
Therefore, the upcoming American inflation data will have an impact on the EUR/USD pair. Economists believe that the American inflation dropped from 8.2% in September to 8.0% in October. They expect that core inflation dropped from 6.6% to 6.5%. These numbers will be significantly higher than the Fed estimate of 2.0%.
The EUR/USD pair will likely react mildly to the latest initial jobless claims data. Economists believe that claims increased from 217k to 220k last week.
EUR/USD forecast
The 4H chart pair formed a double-top pattern at 1.0095 this week. In chart analysis, this pattern is usually a bearish sign. The pair remains slightly above the 25-day and 50-day moving averages while the Stochastic Oscillator moved below the neutral point at 50. It is also above the Ichimoku cloud.
Therefore, the pair will likely continue falling as sellers target the next key support level at 0.9900. A move above the resistance at 1.0065 will invalidate the bearish view.

Ready to trade our advanced signals? We’ve made a list of the best brokers to trade Forex worth using.
