Bearish view
- Sell the EUR/USD pair and set a take-profit at 1.0190.
- Add a stop-loss at 1.0470.
- Timeline: 1-2 days.
Bullish view
- Set a buy-stop at 1.0380 and a take-profit at 1.0500.
- Add a stop-loss at 1.0250.
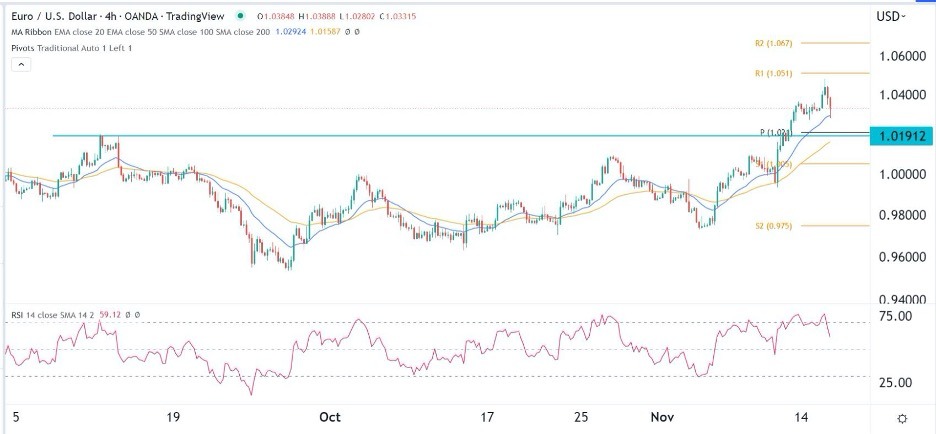
The EUR/USD price retreated slightly in the overnight session as the strong rally took a breather. It pulled back to a low of 1.0285 after the latest EU GDP data and American producer price index (PPI) numbers.
EU GDP and US PPI data
The EUR/USD price pulled back after Europe published the latest GDP data. According to Eurostat, the economy grew by 0.2% in the third quarter after it expanded by 0.8% in Q2. This growth translated to a year-on-year growth of 2.1% in line with expectations.
Additional data showed that the employment change dropped from 0.4% to 0.2% in Q3. Further, the trade deficit narrowed from 52 billion euros to 34.4 billion euros. Meanwhile, numbers showed that the bloc’s inflation has started easing in some countries. In Spain, the headline consumer inflation dropped from 8.9% to 7.3%.
In Sweden and France, inflation expanded by 10.9% and 6.2%, which was also lower than the median estimates of 11.1% and 7.1%, respectively. Therefore, there is also a likelihood that the European Central Bank (ECB) will start to slow its rate hikes in the coming meetings.
The EUR/USD pair also pulled back after the US published the latest producer price index (PPI) data. Like the consumer price index data that was published last week, these numbers showed that the headline and core PPI declined in October.
The next key catalyst to watch will be the upcoming American retail sales data. Analysts surveyed by Reuters expect the numbers to reveal that sales rose from 0.0% in September to 1% in October. They also believe that core sales rose from 0.1% to 0.4%.
Financial results by companies like Home Depot and Walmart showed that consumer spending was vibrant. Home Depot’s revenues came in at over $38.6 billion, which was higher than the consensus estimate of $38 billion.
EUR/USD forecast
The EUR/USD price pulled back slightly in the American and Asian session. On the 4H chart, the pair formed an evening star pattern, which is usually a bearish sign. The pair remains slightly above the 25-day and 50-day moving averages. The Relative Strength Index has moved slightly below the overbought level.
Therefore, the pair will likely continue falling as sellers target the key support at 1.0190, the highest point since September 12. This decline will be part of a break and retest pattern, which will be a sign of a continuation.
 Ready to trade our advanced signals? We’ve made a list of the best brokers to trade Forex worth using.
